
by Ivaylo Ivanov, Ivanhoff Capital
In the examples below, I am using S&P500 data as a proxy for the market.
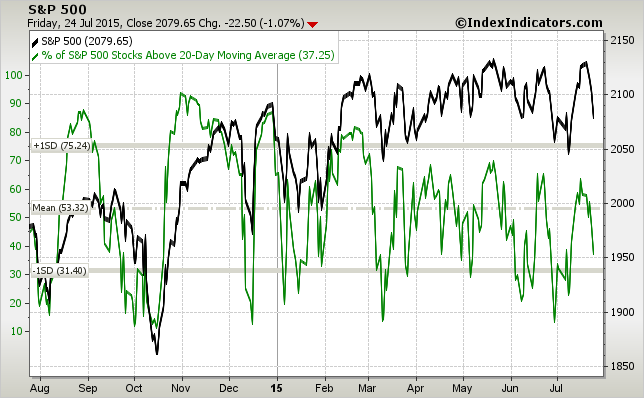
First a short-term perspective: About 37 % of the SPX stocks are still trading above their 20-day moving averages. This doesn’t provide an edge for either bulls or bears. Extreme readings have led to mean-reversion in the indexes during the predominantly range-bound market environment of 2015. Oversold readings (reaching a value under 20%) hasn’t always led to an immediate bounce in the averages. For a more sustainable bounce, look for a divergence – bigger percentage of SPX stocks trading above their 20dma while the SPX keeps making new lows.
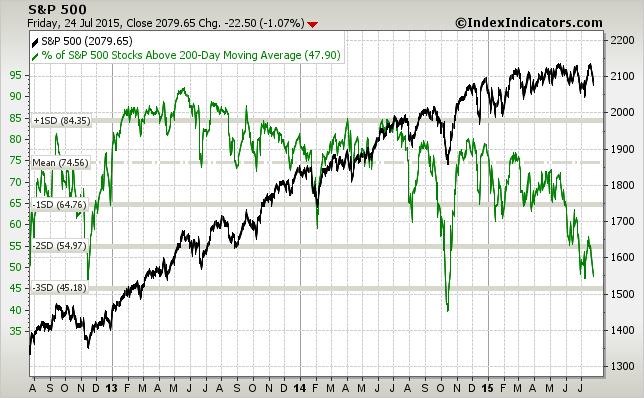
Things are looking a lot different from a long-term perspective:
The % of SPX stocks trading above their 200dmas is almost back to its levels from October 2014, when we had an almost 10% market pullback.
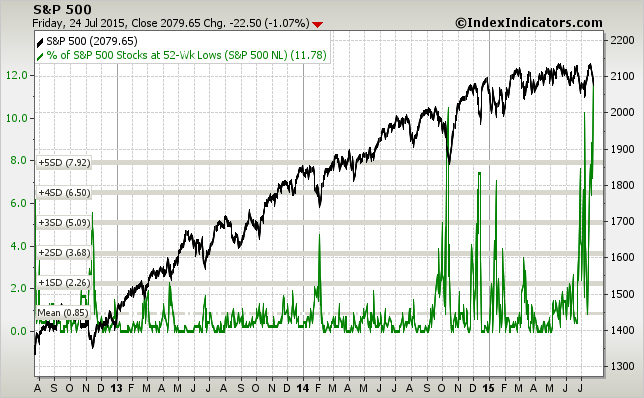
The % of stocks, making new 52-week lows is at multi-year highs. The deterioration in any industry even remotely related to commodities has been breath-stopping.
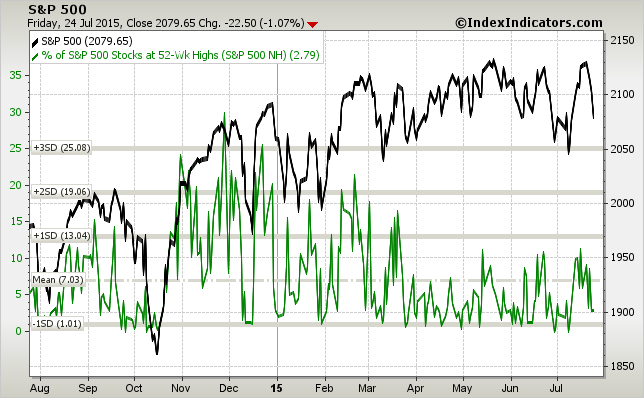
The number of stocks making new 52-week highs has been gradually declining in 2015 and it has now established in a low-value tight range. SPX has managed to keep near multi-year highs thanks to healthcare, financials, tech and consumer discretionary stocks.
The information in this blog post represents my own opinions and does not contain a recommendation for any particular security or investment. I or my affiliates may hold positions or other interests in securities mentioned in the Blog, please see my Disclaimer page for my full disclaimer.
Copyright © Ivanhoff Capital