The 60/40 Forecast: 0% through 2025
by Corey Hoffstein, New Found Research
Benjamin Graham, father of value investing, once said: “in the short run, the market is like a voting machine but in the long run, it is a weighing machine.” The psychology factor that can dominate market returns and volatility in the short-run is often washed out in long-run annualized returns, which is dominated by economic and valuation factors.
While valuations may serve as an anchor, asset prices can deviate wildly – and irrationally – from these levels. To quote John Maynard Keynes: “the market can remain irrational longer than you can remain solvent.” So trying to time the market using valuation factors is notoriously difficult. Often valuations can have you sitting on the sidelines during tremendous bull markets.
Bloomberg had an article this week (http://www.bloomberg.com/news/articles/2015-05-18/nobel-winner-s-math-shows-s-p-500-unhinged-from-reality-or-not) pointing out that the Tobin’s Q Ratio – a measure devised by James Tobin, Nobel laureate in economics, to measure the true ‘replacement cost’ of a business – has flashed a sell signal.
This is somewhat confusing because the measure never actually gave a buy signal in 2009. Followers of this ratio have been on the sidelines. So what are they actually supposed to sell?
While reversion in these valuation measures can take multiple decades – often far longer than most investors’ real timeframes – they are still worth keeping an eye on.
As usual, we’re proponents of “keeping it simple.” At Newfound, we like to take a look at bond valuations (based on 10-year US Treasury rates) and equity valuations (using the Buffett Indicator: U.S. equity market capitalization / U.S. GDP).
While we don’t use valuations to make investment decisions, keeping our eye on the overall market environment is critical in on-going risk management.
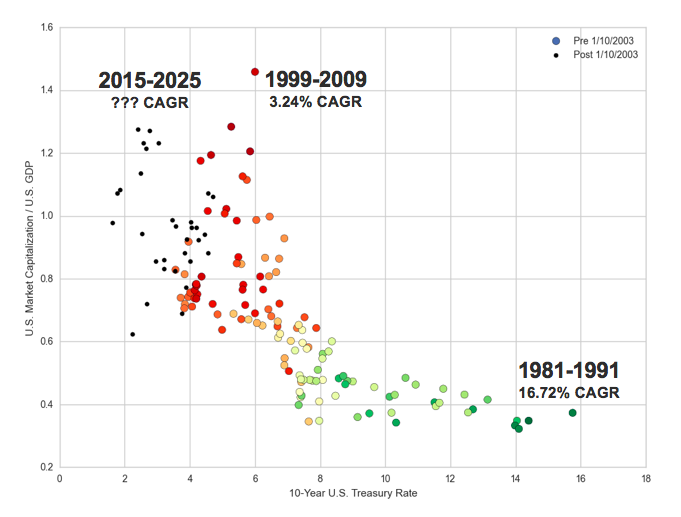
In the scatter graph above, we have plotted 10-year Treasury Rates versus the Buffett Indicator. We then added color to each point based on the forward 10-year annualized nominal return of a 60/40 portfolio from that date. Black points are periods where we don’t know the forward 10-year returns yet (currently, Q2 2005 and onward).
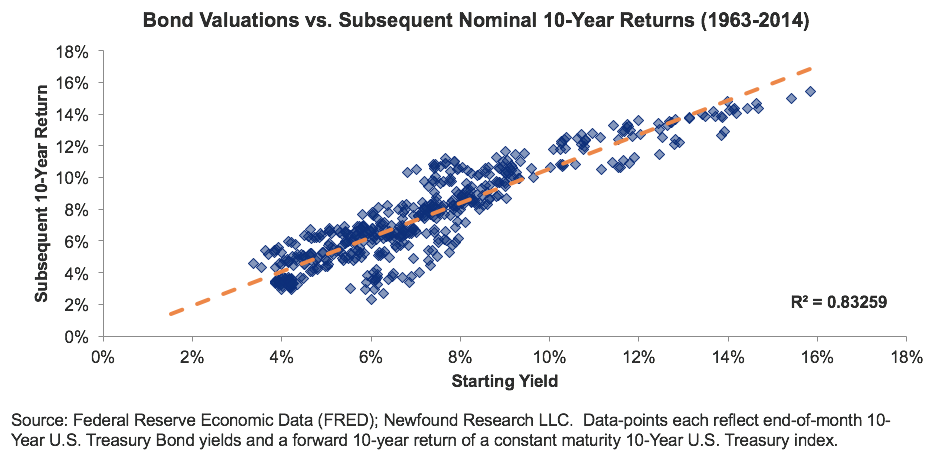
I want to emphasize that these are nominal returns, not real returns. This is an important distinction because it allows us to use a very simple model to estimate future nominal returns on bonds based on interest rates.
Our model is simple: the forward nominal annualized return over the next 10-years for a 10-year US Treasury index is equal to the starting yield today. So if we buy the index when yields are at 5%, we can expect about a 5% annualized nominal return over the next decade.
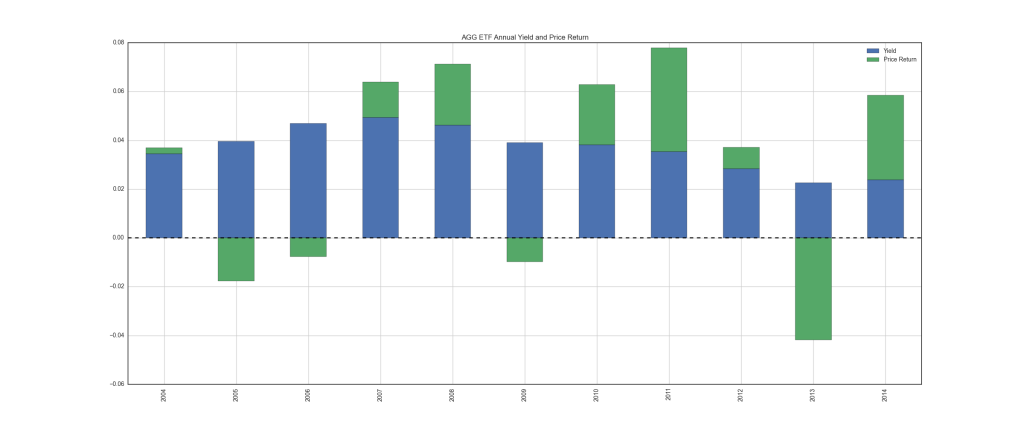
This is possible because the majority of return in bond indices comes from the income component instead of price return. To steal a graph from last week’s commentary, we can look at estimated annualized yield (assuming no reinvestment and 0% return on cash) and price return of the iShares Core U.S. Aggregate Bond ETF ("AGG"). On average, the magnitude of yield is 3.5x that of price return.

Returning to our scatter plot, we can start in the lower right hand corner: the early 1980s. This was a period of high interest rates (which indicate high forward nominal bond returns) and low equity valuations (which forecast high forward equity returns). Unsurprisingly, a passive 60/40 portfolio posted a nominal annualized return of 16.72% over the next decade.
Fast forward to 1999: the highest ever reading for our equity valuations and much, much lower interest rates (approximately 6%). Not surprisingly, the annualized nominal return over the next decade was only 3.24%.
Unfortunately, despite feeling like we just emerged from a lost decade of returns, we may be headed for another. With equity valuations near nose-bleed levels and 10-year rates less than 2.5%, the forecast is grim. After inflation? We might be stuck with nothing.
Of course, this is the forecast for annualized returns: it says nothing about the path of the returns. And this is where the good news lies. While we can never guarantee that the future will look like the past, the market has been very consistent in one respect over the last 100+ years: each decade tends to include years of both feast and famine.
Since 1900, the average difference between the best and worst year for a 60/40 portfolio over rolling ten year periods is an astonishing 39%. More than 90% of ten year periods have at least one year where a 60/40 would have returned more than 20% while more than half of these periods have at least one year in which the 60/40 lost double digits.
This of course does not mean that we could never see an entire decade of muted returns. But it does suggest that more often than not the market provides tactical approaches with the raw material to add value, regardless of prevailing valuations.
While long-term returns may be anchored to valuations, short-term returns are overwhelmed by psychology and emotion. We believe that this reflects an opportunity to adapt our portfolios in a tactical manner, selectively increasing risk to capture positive returns and then having a disciplined process to take that risk back off when market clouds start to form.
In Our Models
There were no changes in our portfolios this week, however, we have continued to see some interesting trends under the hood of our Multi-Asset Income strategy. Three things that have jumped out at us:
- Clear weakness in fixed income. Of the sixteen exposures we consider, six consist of traditional, fixed-rate bonds (high yield, U.S. dollar denominated E.M. bonds, local currency denominated E.M. Bonds, investment grade corporates, 20+ year U.S. Treasuries, and international Treasuries). Only one of these six exposures – U.S. dollar denominated E.M. bonds – currently has a positive signal. In fact, the only negative signal in the universe that does not belong to this group is MLPs. Note: We’ve excluded exposures with hybrid debt/equity characteristics like preferreds or with embedded optionality like convertibles.
- Reduced volatility. Across the entire universe, our models see about 12.5% less volatility today compared to one month ago. High Yield, USD denominated E.M. bonds, U.S. dividend stocks, covered calls, and bank loans have all seen volatility reductions greater than 20%.
- Separation between the haves and the have-nots. Exposures with positive signals are farther from turning negative compared to last month and exposures with negative signals are farther from turning positive compared to last month.
About Corey Hoffstein
Corey Hoffstein is chief investment officer of Newfound Investments, an investment management affiliate of Virtus Investment Partners, and co-founder, chief investment officer, and chief technology officer of Newfound Research.
Mr. Hoffstein pioneered the original research and the implementation of the proprietary technology used to construct the models at Newfound Research. He is responsible for overseeing the firm’s Product Development and Quantitative Strategies group and the ongoing management of the firm’s strategies. Mr. Hoffstein also takes an active role in the management of the firm, directing business development and strategic growth initiatives.
Mr. Hoffstein is a cum laude graduate of Cornell University, having earned a B.S. in computer science. He also earned his M.S. in computational finance from Carnegie Mellon University.
Copyright © New Found Research


