For the first time since the early 1980s, the US economic outlook may face simultaneous increases in debt levels and effective interest rates.
by James McCormack, Global Head of Sovereign Ratings, Fitch Ratings
Private sector deleveraging has been a critical feature of the post-crisis US economic recovery, and will remain an important consideration for growth and stability as interest rates move higher. Borrowers have benefitted from a more-than 30-year trend of falling rates, but the eventual reversal will test the degree to which private sector balance sheets have been strengthened in the post crisis period. With debt levels still high by historical standards, higher interest rates may have a pronounced impact on growth in the period ahead.
A Cycle Ends: Meaningful Deleveraging
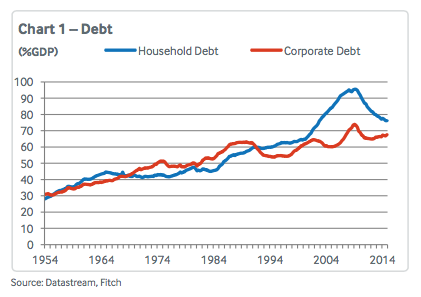
 The increase in household debt by 30 percentage points of GDP between 2000 and 2008 was unprecedented, ashas been the subsequent deleveraging (chart 1). The previous 30 percentage point increase took more than 40years, and there had never been a meaningful deleveraging prior to 2009. At end-2014, household debt was backto its 2002 level as a share of GDP, and below its 2008 peak in nominal terms.
A similar, though less marked, pattern is evident in the corporate sector, unlike in previous credit cycles whencorporate debt levels were more volatile than those of households. Corporate debt is now lower than in 2009 as ashare of GDP, but 12% higher than the pre-crisis peak in nominal terms.
The Long View: Lower Rates Allowed for Higher Debt
Taking a much longer view, even accounting for post-crisis reductions, household and corporate debt levels have trended higher since the early 1950s (when data became available). Moreover, it is widely accepted – if not explicitly acknowledged – that a continuation of this trend is a sign the US economy is getting back to “normal”. The resumption of private sector credit growth on the back of improved balance sheets is a big part of the narrative of the US recovery, and a meaningful difference with conditions in the Eurozone.

Historical interest rate developments provide insight to the steady run-up in US debt, and are a basis of concern looking forward. Both nominal and real medium-term interest rates (approximated by 10-year US Treasury yields) have been falling since the early 1980s. Over the same period, there have been matching declines in effective interest rates faced by the household and corporate sectors (chart 2). Effective rates are calculated using BEA data on Interest Paid and Received by Sector, and Flow of Funds data on outstanding debt stocks. Critically, for the last 30 years, falling interest rates have offset the effects of higher debt levels to keep interest service ratios manageable (chart 3).
Where to Now? Can Interest Rates and Indebtedness Both Increase?
There is a strong historical relationship between US economic growth and interest rates in both real and nominal terms. Over the last 50 years real GDP growth and 10-year US Treasury yields (using the GDP deflator) averaged 3.1% and 3.0%, respectively. In nominal terms they averaged 6.7% and 6.6%. On this basis, with 10-year Treasuries yielding less than 2%, they appear low by historical standards.

Current conditions are certainly not unique. There have been periods when 10-year Treasury yields were consistently lower than economic growth. The last episode was the mid-2000s, when a global savings glut led to what Alan Greenspan described as a “conundrum”, whereby increases in the Fed Fund rate from 2004 were not matched by 10-year yields. With reasonably strong US growth at the time, households and corporates responded as might be expected – they borrowed more. Private credit growth subsequently outpaced nominal GDP growth and was one of the contributing factors of the global financial crisis.
The critical question is what will happen to 10-year Treasury yields and the effective interest rates faced by the corporate and household sectors as monetary policy is tightened in the current cycle? With smaller current account surpluses in Asia and among Middle East oil exporters, it seems less probable that a global savings glut will continue to hold US rates down.
Despite the deleveraging that began in 2009, neither the household nor corporate sector is particularly well placed for a higher interest rate environment. Household interest payments as a share of GDP are now at the same level as the mid-1970s, when debt was lower by 35 percentage points of GDP. Corporate sector debt has increased by less, but interest payments are also at mid-1970s levels. It appears that for the first time since the early 1980s, the outlook for the US economy may be characterised by simultaneous increases in debt levels and effective interest rates. The difference now, however, is household and corporate debt levels are much higher, suggesting the potential for a much more negative impact in terms of debt sustainability and economic performance.
Copyright © Fitch Ratings