
by Dana Lyons, J. Lyons Funds Management, Inc.
We’ve mentioned before (alright, in nearly every post) that we have several major longer-term concerns with respect to the stock market. One such concern has to do simply with prices themselves – in both space and time. In a post last November, we highlighted the fact that relative to the S&P’s long-term trend, prices were more than 90% “overbought” or extended. The only previous instance when prices got so high was during the dot.com bubble. Additionally, prices are historically extended in terms of time. That is, they have rallied for far longer without an intermittent correction than almost any other period since 1950.
Today’s Chart Of The Day plots the number of 10% reversals in the S&P 500 over every rolling 3-year period since 1950. As the chart shows, we are currently experiencing just the 5th 3-year period ever without a single 10% reversal in prices.
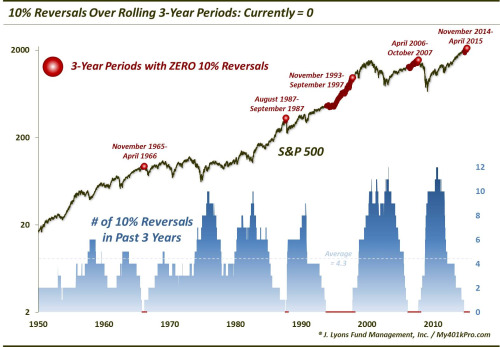
Since 1950, the average number of 10% price reversals in the S&P 500 over a 3-year period is 4.3. For the index to have exhibited none in 3 years is rare, as in less than 10% of the time. Take away one monster of a run during the mid-1990′s which encompassed nearly two thirds of all historical occurrences (see below) and it is exceedingly rare: just 3.6% of all days since 1950.
Given the fact that bull markets tend to persist longer than bear markets, it’s no surprise that the previous 4 instances also occurred during a prolonged market advance rather than a decline. Because of that, these runs without a 10% reversal were ended by a 10% decline. That point is obvious. However, with one exception, these periods did not just end poorly, but spectacularly so. Here are each of the occurrences.
- November 1965 - April 1966 While this run was ended by a 23% decline, that was not the worst part. The 1966 peak ended the 17-year secular bull market and ushered in a secular bear that saw prices at roughly the same level 16 years later.
- August 1987- September 1987 Obviously this streak ended with the crash in October 1987. From its August top to October low, the S&P 500 lost some 35%.
- November 1993 - September 1997 Not only was this by far the longest streak of rolling 3-year periods without a single 10% reversal, it was also the exception to the “spectacularly poor” endings. After more than 1000 days, this one culminated in a 13% drop. And while it was unnerving at the time (in the midst of the Asian financial crisis), it was a very tame ending compared with the others.
- April 2006 - October 2007 The 2007 peak begat the cyclical bear market during which prices dropped by over 50% in just 18 months.
So you see that these rare 3-year periods without a 10% price reversal have ended terribly on 3 of the 4 occasions. That’s the bad news. The good news is that there is no reason why this particular run without a 10% correction has to come to an end soon. Timing the streak’s culmination will be as challenging as every other attempt to manage risk over the past few years. Yes, the 1987 occurrence lasted only 2 months and the 1966 occurrence lasted just 5 months, on par currently with our present case. However, the 2007 occurrence went another year beyond where we’re at right now. And it would take an additional 40 months from here to equal the mid-1990′s version.
So, is the market due for a 10% correction? Of course (and not merely due to the Jesse Felder Beard Index). We certainly aren’t the first ones to point that out. However, we have attempted to quantify the unusual nature of the recent correction-less period, from a historical perspective. There have been only 2 periods in history that have gone longer without a 10% reversal (in this case, lower) in the S&P 500. Those 2 periods, however, were much longer in one instance, and much, much, much longer in the other. Thus, in terms of helping to hone in on the timing of the next correction, this knowledge may not be of much assistance. For the sake of perspective, however, sometimes it’s helpful to at least know where you are even if you don’t know where you are going.
_____________
“faire le toure” photo by Mamzel*D.
More from Dana Lyons, JLFMI and My401kPro.
The commentary included in this blog is provided for informational purposes only. It does not constitute a recommendation to invest in any specific investment product or service. Proper due diligence should be performed before investing in any investment vehicle. There is a risk of loss involved in all investments.
Copyright © J. Lyons Funds Management, Inc.