


It has definitely been a tale of two markets; both consist of many energy and materials names, but the major difference lie in the percentage weights within their respective indices. Since early 2012, the two Canadian indices who before then showed a fairly high correlation, began to significantly diverge. For this week's Equity Leaders Weekly, we are going to look at each in more detail and try to explain the moves we have seen in opposite directions over the past 3+ years.
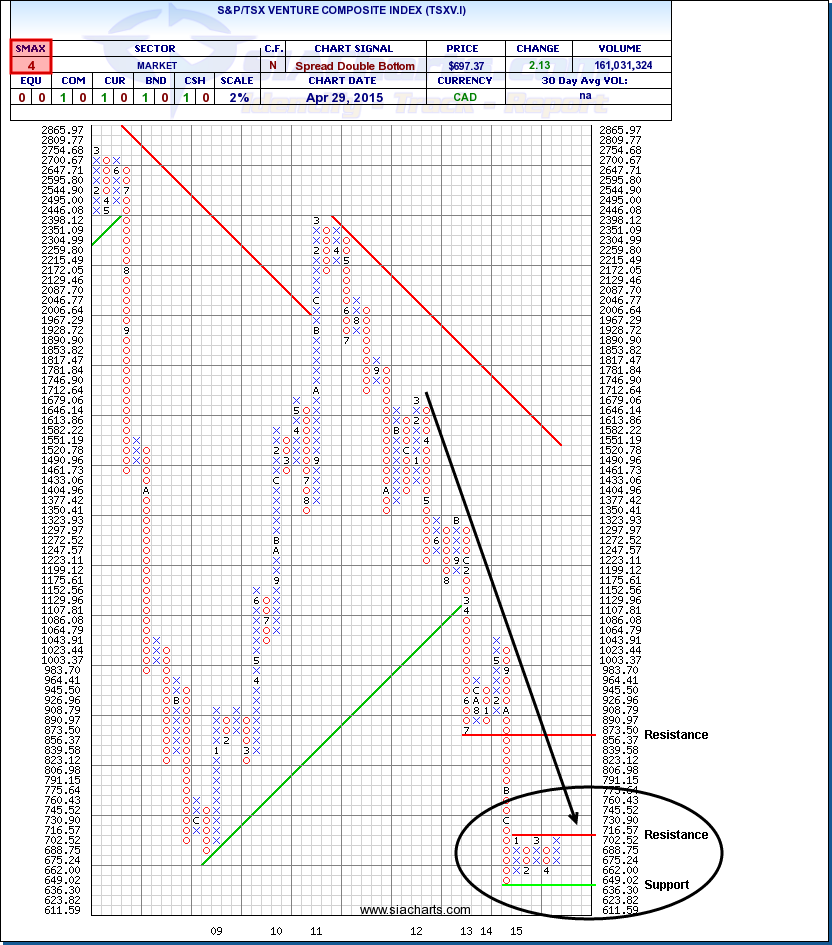
S&P/TSX Venture Composite Index (TSXV.I)
On December 16, 2014 the S&P TSX Venture Composite Index set a new record for its all time lowest closing price at 642.35 points. Only a month earlier on November 28th, it celebrated its 15 year anniversary, the new exchange was a combination of the Vancouver Stock Exchange, the Alberta Stock Exchange, the Canadian Dealer Network, and the Montreal Stock Exchange.
From that date 4 months ago, the index has been bouncing between support at 636.30 and resistance at 716.57. Many investors are now asking whether this capitulation possibly represents a reversal of fortune or just a break from a continued downward journey.
Looking at the components of the index, a main dragging force has been the mining exploration companies which comprise of almost 50% of the index (201 companies of the 406 listings). The second largest sector is energy representing more than 20% of the constituents in oil and gas exploration, and energy services companies. With well over 70% of the index exposed to these two sectors which have been beaten up badly, it is obvious to see why this Canadian stock market has been in such a decline over the past three and a half years.
Click on Image to Enlarge
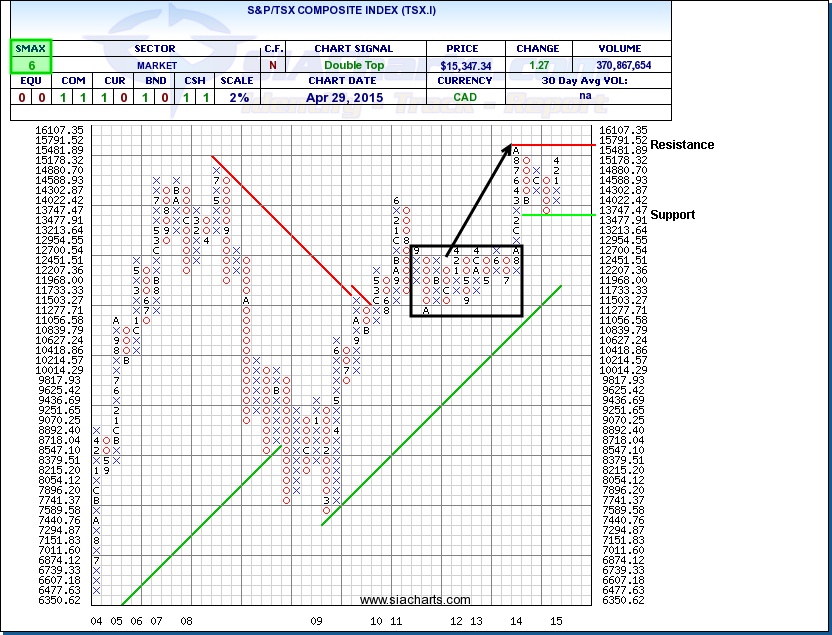
S&P/TSX Composite Index (TSX.I)
With the dramatic turnaround seen in most worldwide markets from their lows in 2009, both of these Canadian indices moved upwards together for the next 2 years. Then in mid 2011 when both markets witnessed a pull-back, their strong correlation up to that point reversed. From then, the S&P TSX Venture continued its dramatic slide.
In contrast, the S&P/TSX Composite Index held its ground moving in a sideways consolidating pattern from late 2011 until early 2014. After breaking through strong resistance at 12,954 in early 2014, the index ran to new historical all-time highs.
If we look deeper into the components of this index we can get a glimpse into the fundamental differences between the two indices. The S&P/TSX Composite Index consists of 248 names with an adjusted market cap of 1,931.887 (C$ Billion). The largest sector components are Financials at 34.78%, Energy 22.05%, Materials 10.91%, Industrials 8.06%, Consumer Discretionary 6.26%, Health Care 5.03%, Telecom 4.65%, Consumer Staples 3.59%, Info Tech 2.47, and Utilities at 2.19%.
Comparing the Venture index which has over 70% in energy and mining names, the S&P/TSX composite consists of less than 33% in those two sectors. This being a much more diversified universe allows for additional cushioning during times of certain sector weakness. It is obvious that such a dramatic overweighting as seen in the Canadian Venture exchange can be greatly beneficial during strong economic times, but also brutally painful during weakness.
Click on Image to Enlarge
For any questions on this concept, please call or email us at 1-877-668-1332 or siateam@siacharts.com.
*******
SIACharts.com specifically represents that it does not give investment advice or advocate the purchase or sale of any security or investment. None of the information contained in this website or document constitutes an offer to sell or the solicitation of an offer to buy any security or other investment or an offer to provide investment services of any kind. Neither SIACharts.com (FundCharts Inc.) nor its third party content providers shall be liable for any errors, inaccuracies or delays in content, or for any actions taken in reliance thereon.
Copyright © SIACharts.com