
With the continued volatility in the Commodities markets, this week for the SIA Equity Leaders Weekly, we are revisiting both Crude Oil and Natural Gas outlooks to see if we can discern what is happening with both of them.
Crude Oil Continuous Contract (CL.F)
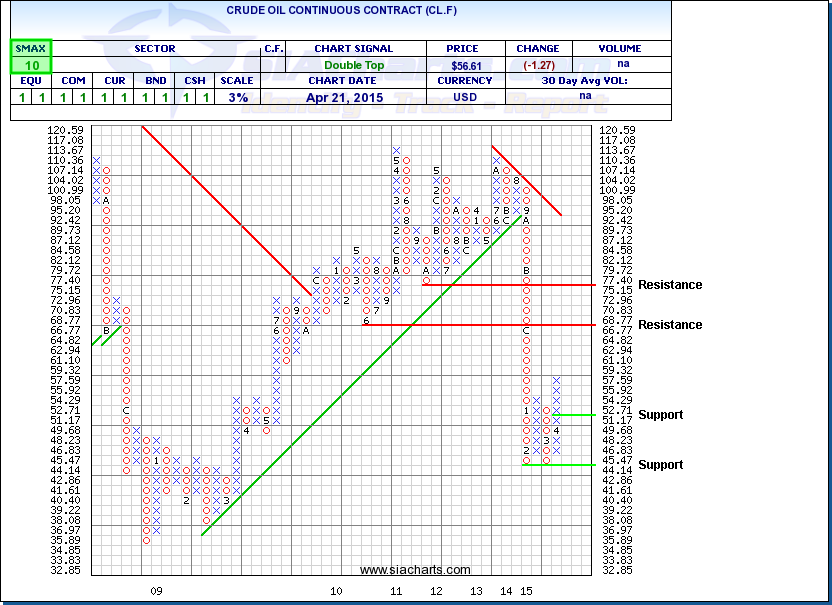
When we last looked at Crude a month ago, it was sitting on a very important support level down at $44.14 that has since held. Crude has had a very positive bounce off this level, with the next resistance still way overhead up at $68.77. What is interesting to note is that the SMAX score has gone from 0 to 10 in the last month, now showing short term strength across all the asset classes.
To the downside, support is found at $51.17 should this short-term strength reverse again like it did in February/March. Still keeping in mind the potential long-term supply/demand relationship for crude oil, according to the Energy Information Administration, U.S. production of crude oil is producing at its highest level ever at more than 9.3M barrels per day and still increasing. While at the same time according to Baker Hughes, the U.S. oil rig count has fallen sharply since oil prices crashed from a high in late 2014 around 1,600 to about half around 800 now.
Click on Image to Enlarge
Natural Gas Continuous Contract (NG.F)
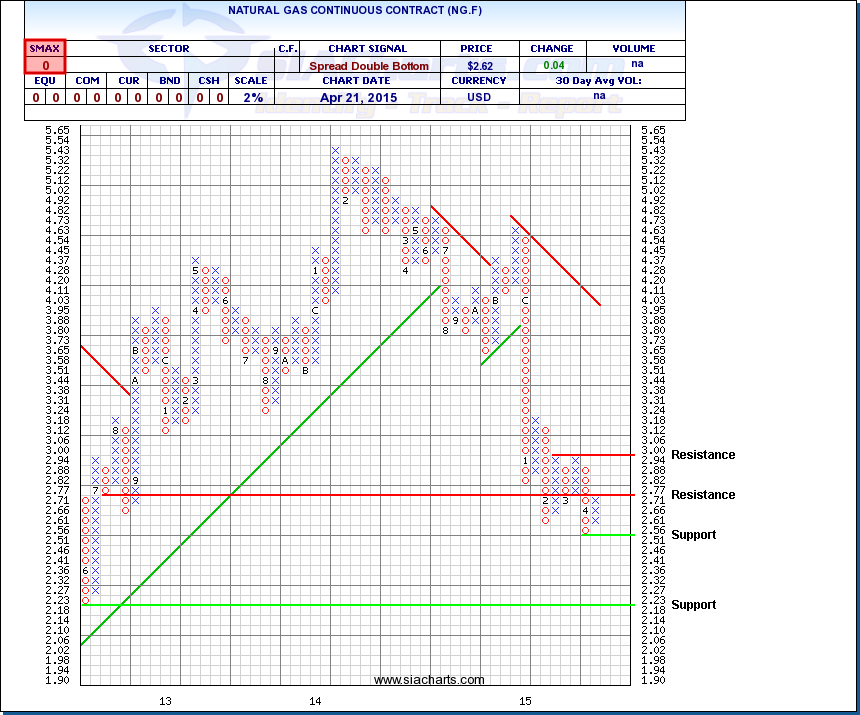
Unlike Crude Oil, Natural Gas has not seen a big positive spike up recently, instead setting new multi-year lows earlier this month. It has had a little bit of a positive move though, now pushing up against its first resistance level at $2.77. Further strength could see the next resistance up at $3 come in to play, a level that has already held twice in the first quarter of this year.
With the SMAX sitting at 0, NG.F is showing short-term weakness across all asset classes, so for those trading this, you need to keep a close eye on the support level at $2.51 and again below that at $2.18.
On an asset class level, Commodities continues to sit down as the weakest of the 7 asset classes so for those who are trading this space please be careful as this is still an area where you could see higher risk in your investments.
For any questions on this concept, please call or email us at 1-877-668-1332 or siateam@siacharts.com.< em>
Click on Image to Enlarge
SIACharts.com specifically represents that it does not give investment advice or advocate the purchase or sale of any security or investment. None of the information contained in this website or document constitutes an offer to sell or the solicitation of an offer to buy any security or other investment or an offer to provide investment services of any kind. Neither SIACharts.com (FundCharts Inc.) nor its third party content providers shall be liable for any errors, inaccuracies or delays in content, or for any actions taken in reliance thereon.