by Don Vialoux, EquityClock.com
Editor’s Note: Mr. Vialoux is scheduled to appear on BNN’s Market Call Tonight at 6:00 PM EDT
Pre-opening Comments for Tuesday April 14th
Editor’s Note: Next Tech Talk is released on Thursday
U.S. equity index futures were slightly lower this morning. S&P 500 futures were down 3 points in pre-opening trade.
Index futures weakened slightly following release of economic news at 8:30 AM EDT. Consensus for March Retail Sales was an increase of 1.0% versus a decline of 0.6% in February. Actual was an increase of 0.9%. Excluding auto sales, consensus for March Retail Sales was an increase of 0.7%. Actual was an increase of 0.4%. Consensus for March Producer Prices was an increase of 0.2% versus a decline of 0.5% in February. Actual was an increase of 0.2%. Excluding food and energy, consensus for March Producer Prices was an increase of 0.1%. Actual was an increase of 0.2%.
JP Morgan and Johnson & Johnson reported slightly higher than consensus first quarter earnings. In addition, JP Morgan increased its dividend. JP Morgan added $0.63 to $62.70. Johnson & Johnson gained $0.42 to $100.97.
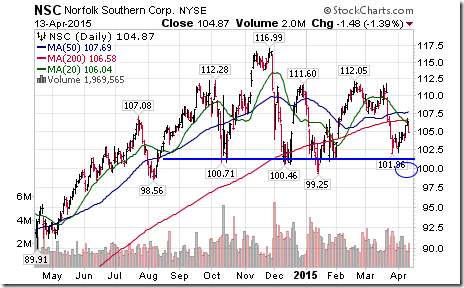
Norfolk Southern plunged $5.62 to $99.25 after lowering first quarter guidance
Apple advanced $0.22 to $127.07 after Susquehanna raised its target price to $150 to $145.
Rockwell Automation (ROK $111.28 is expected to open lower after Stifel Nicolaus downgraded the stock to Hold from Buy.
Qualcomm added $0.37 to $69.10 after Bank of America/Merrill upgraded the stock to Buy.
Susquehanna launched coverage on the beverage sector. Coca Cola slipped $0.10 to $40.60 on an initial negative rating. Pepsico added $0.12 to $95.65. Molson Coors (TAP $76.63) also was given an initial positive rating.
EquityClock’s Daily Market Comment
Following is a link:
http://www.equityclock.com/2015/04/13/stock-market-outlook-for-april-14-2015/
Note comments on U.S. equity indices that currently are testing resistance. Also, note comments on the seasonality of the U.S. Dollar Index.
Interesting Charts
After the close yesterday, Norfolk Southern issued negative first quarter guidance. The stock briefly fell below $100. Technical deterioration was significant (head and shoulders pattern).
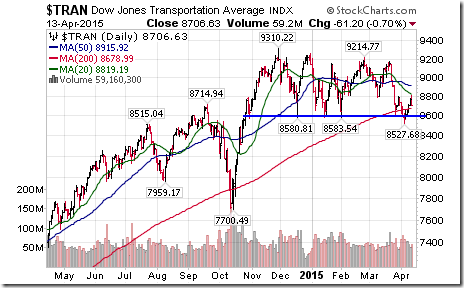
Look for the Dow Jones Transportation Average to have a rough opening at a critical support level!
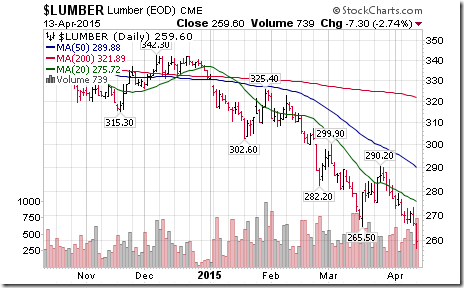
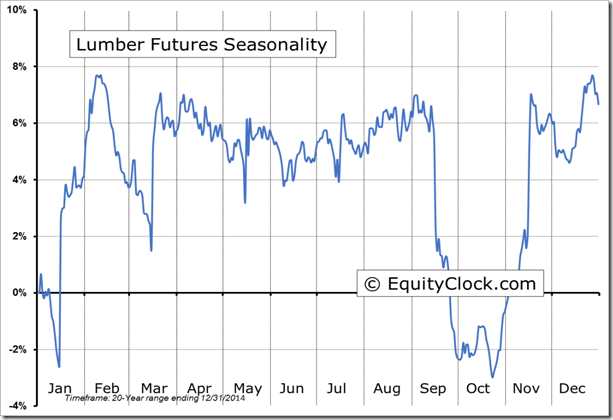
Lumber prices remain under pressure. Not good news for expectations for higher new home starts this spring!
‘Tis the season for weakness in lumber prices!
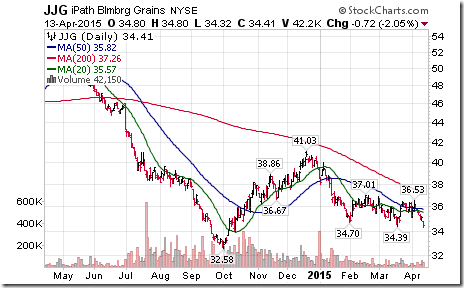
Grain prices remain under pressure
StockTwits Released Yesterday
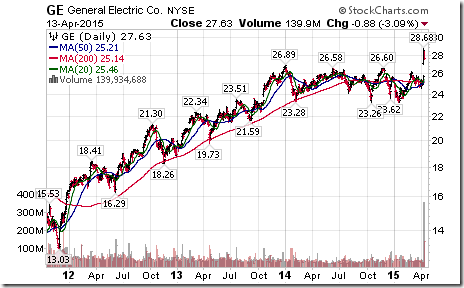
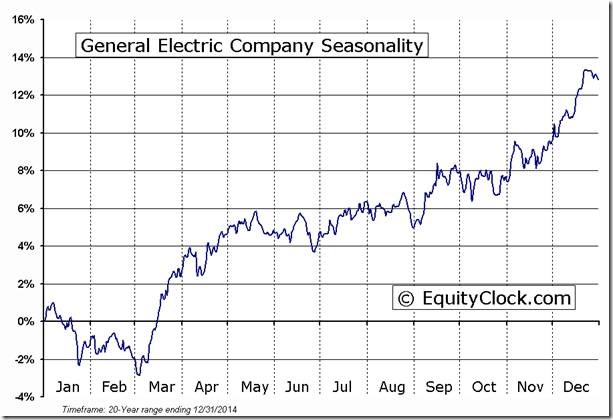
General Electric ($GE) breaking out from the grips of the “lost decade” during period of seasonal strength.
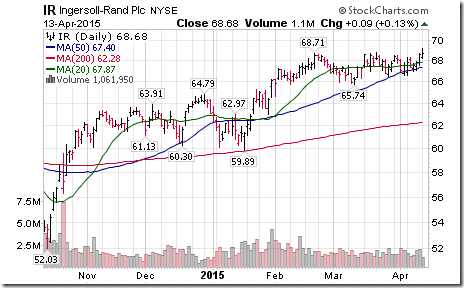
Technical action by S&P 500 stocks to 10:15: Quietly bullish. Breakouts: $MRO, $JPM, $STJ, $IR, $ISRG.
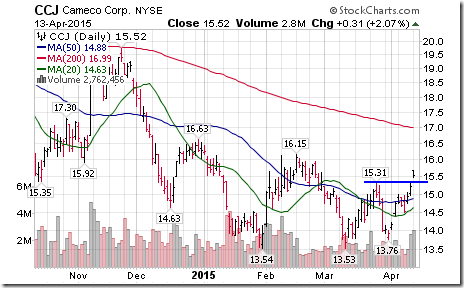
Nice breakout by Cameco $CCJ and $CCO.CA on an upgrade by Merrill to Buy!
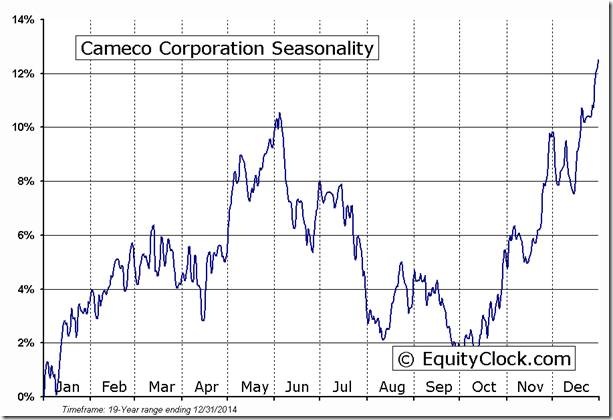
‘Tis the season for Cameco to move higher!
Technical Action by Individual Equities
After 10:15 AM, technical action by S&P 500 stocks was quiet. Alliance Data Systems (ADS) broke resistance while Tesoro (TSO) and Level 3 (LVLT) broke support.
Among TSX 60 stocks, Teck Corp and Kinross broke support in U.S. Dollars.
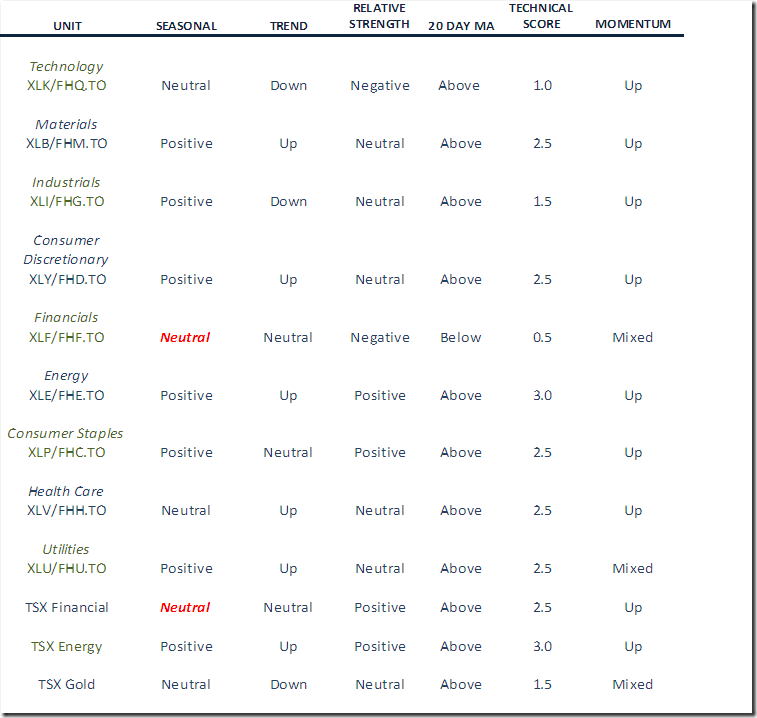
Equity Trends
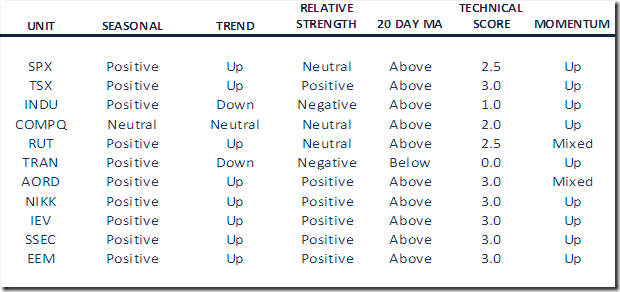
Daily Seasonal/Technical Equity Trends for April 13th
Green: Increase from the previous day
Red: Decrease from the previous day
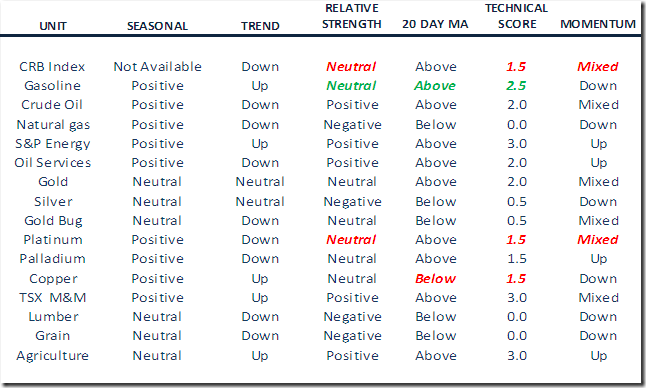
Commodities
Daily Seasonal/Technical Commodities Trends for April 13th
Green: Increase from previous day
Red: Decrease from the previous day
Sectors
Daily Seasonal/Technical Sector Trends for April 13th
Green: Increase from previous day
Red: Decrease from previous day
Special Free Services available through www.equityclock.com
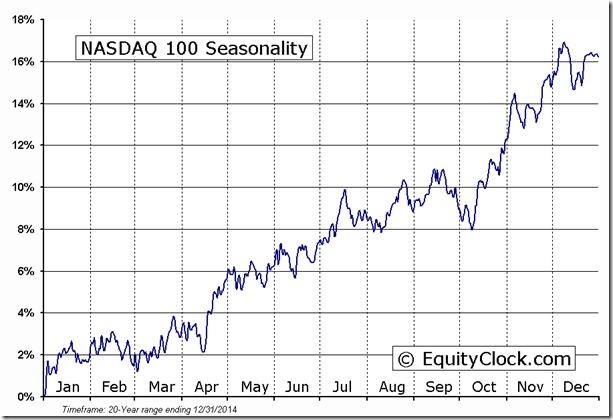
Equityclock.com is offering free access to a data base showing seasonal studies on individual stocks and sectors. The data base holds seasonality studies on over 1000 big and moderate cap securities and indices. To login, simply go to http://www.equityclock.com/charts/
Following is an example:
NASDAQ 100 Seasonal Chart
^NDX Relative to the S&P 500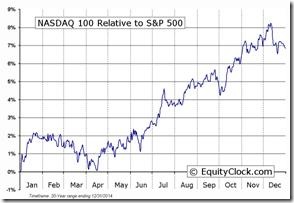 |
Disclaimer: Comments, charts and opinions offered in this report by www.timingthemarket.ca and www.equityclock.com are for information only. They should not be considered as advice to purchase or to sell mentioned securities. Data offered in this report is believed to be accurate, but is not guaranteed. Don and Jon Vialoux are Research Analysts with Horizons ETFs Management (Canada) Inc. All of the views expressed herein are the personal views of the authors and are not necessarily the views of Horizons ETFs Management (Canada) Inc., although any of the recommendations found herein may be reflected in positions or transactions in the various client portfolios managed by Horizons ETFs Management (Canada) Inc.
Individual equities mentioned in StockTwits are not held personally or in HAC.
Horizons Seasonal Rotation ETF HAC April 13th 2015
Copyright © EquityClock.com


![clip_image002[5] clip_image002[5]](https://advisoranalyst.com/wp-content/uploads/HLIC/66a55e69e4ced2e839dbbe7c6b197a57.png)


