
The Technical Outlook for Oil (Part 2)
by Donald W. Dony, FCSI, MFTA, The Technical Speculator
Following part 1 of the Technical outlook for oil on April 7, this report examines the effect of the secular Commodity cycle on stocks (S&P 500), the U.S dollar on the CRB and WTIC's price since 1980.
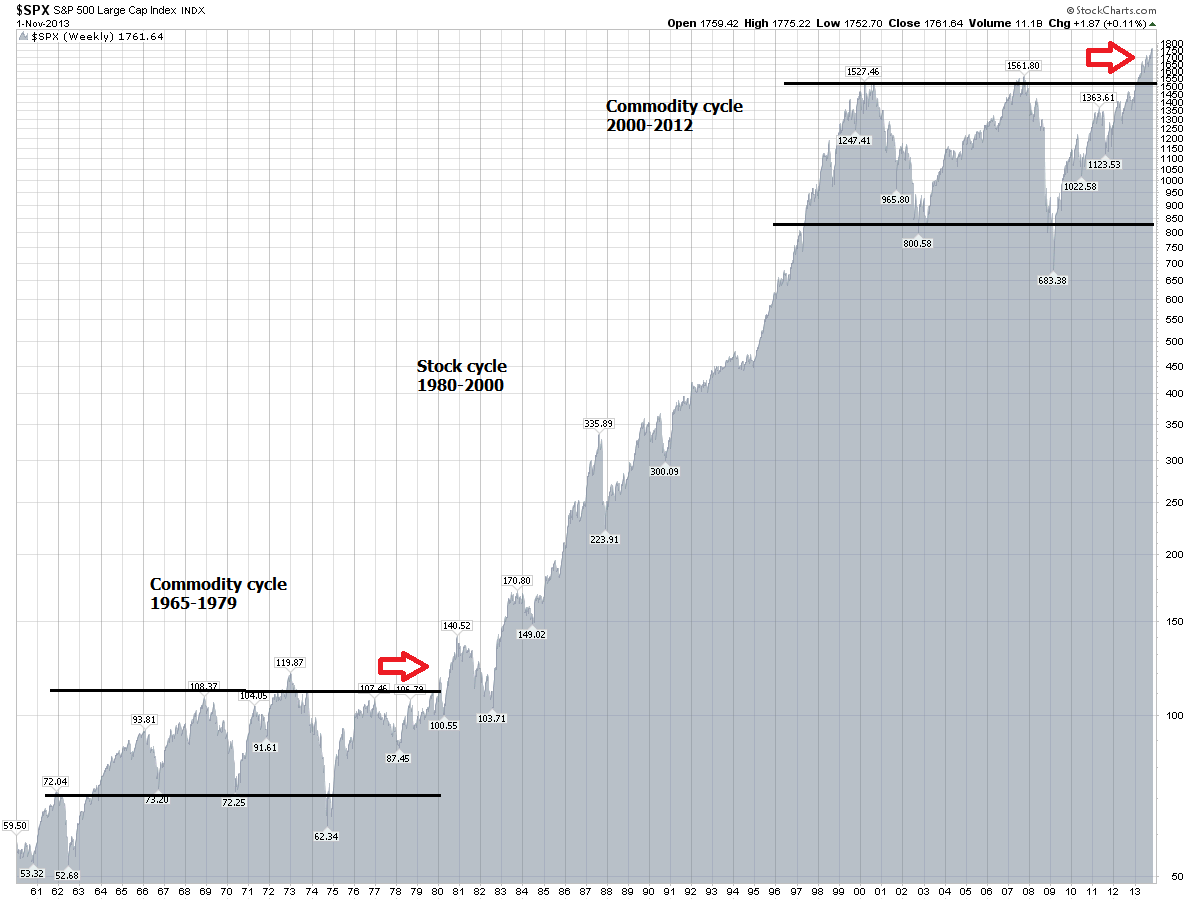
Chart 1 is the S&P 500 since 1960. It traces the different trading patterns of the U.S. index during a secular Commodity cycle (1965-1980), a Stock cycle (1980-2000) and through another Commodity cycle (2000-2013) and the beginning of a new Stock cycle (2013 to present).
The pattern of the S&P 500, during commodity-dominated cycles (1965-1980 and 2000-2013), are similar. The U.S. index trades within a well-defined range with deep and prolonged corrections.
Most recently, the S&P 500 has broken out of the trading range in 2013 (similar to the breakout of the 1965-1980 Commodity cycle), signaling, in our opinion, the end of another secular Commodity cycle and the expected beginning of another Stock cycle.
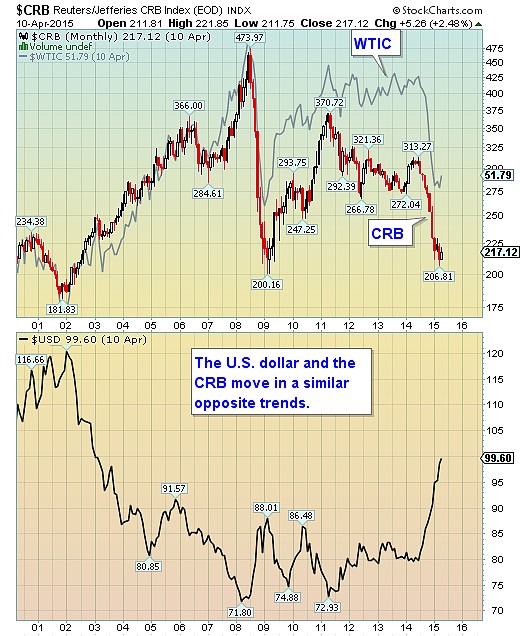
In Chart 2 (click to enlarge), illustrates one of the main elements of a Stock cycle; a rising U.S. dollar.
The US$ bottomed in 2008 and eventually broke out 2014 with strong market support.
The immediate effect on the CRB is downward pressure. The Commodity Research Bureau index fell 30% in 2014 whereas the US$ rose 25%.
Energy-related commodities (oil, natural gas and gasoline), which are the largest single component in the CRB, dropped a remarkable 50% in value in 2014.
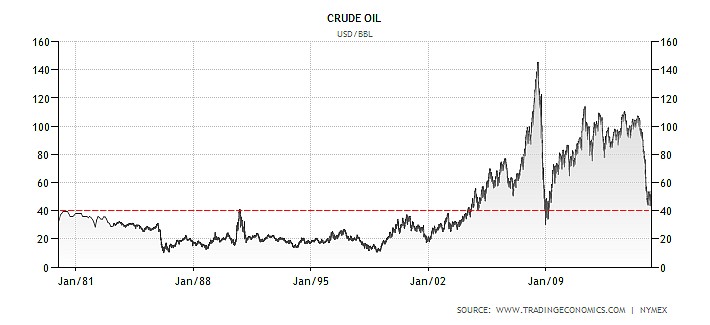
Chart 3 (click to enlarge) is Light crude oil prices during the 1980-2000 Stock cycle, the 2000-2013 Commodity cycle and the start of the most recent Stock cycle (2013 to present).
WTIC remained range-bound below $40 throughout the last Stock cycle (1980-2000) only to rebound above $40 as the Commodity cycle began to unfold.
However, with the end of the Commodity cycle in 2013 and the beginning of a new Stock cycle, oil prices fell to the $40 support mark in 2014.
Bottom line: WTIC prices are following the pattern of a completion of a Commodity cycle and the start of a new Stock (S&P 500) cycle. The rising U.S. dollar, new highs in the S&P 500 and the on-going shift of capital toward non-commodity sectors helps to reinforce our belief that a new secular Stock cycle has begun.
As in the last Stock cycle (1980-2000), we anticipate that WTIC prices will remain contained. However, unlike in the last Stock cycle where oil held within the $10-$40 range, we believe WTIC should be remain above the $40 support level but hold to the $40-$65 range.
Donald W. Dony, FCSI, MFTA, The Technical Speculator
Copyright © The Technical Speculator