
by Ben Carlson, A Wealth of Common Sense
Earlier this week I posted a handful of graphs that showed rolling returns for the stock market over various time frames. The point was to show how much variation in performance there’s been historically over shorter time frames compared with a much narrower range in long-term returns.
A few people asked me to show similar charts on bonds, as many investors are wondering what the impact of a potential rise or sideways slog in rates could do to future returns in fixed income. The problems is that it’s not exactly an apples-to-apples comparison with stock returns because bonds are more or less driven the starting interest rate.
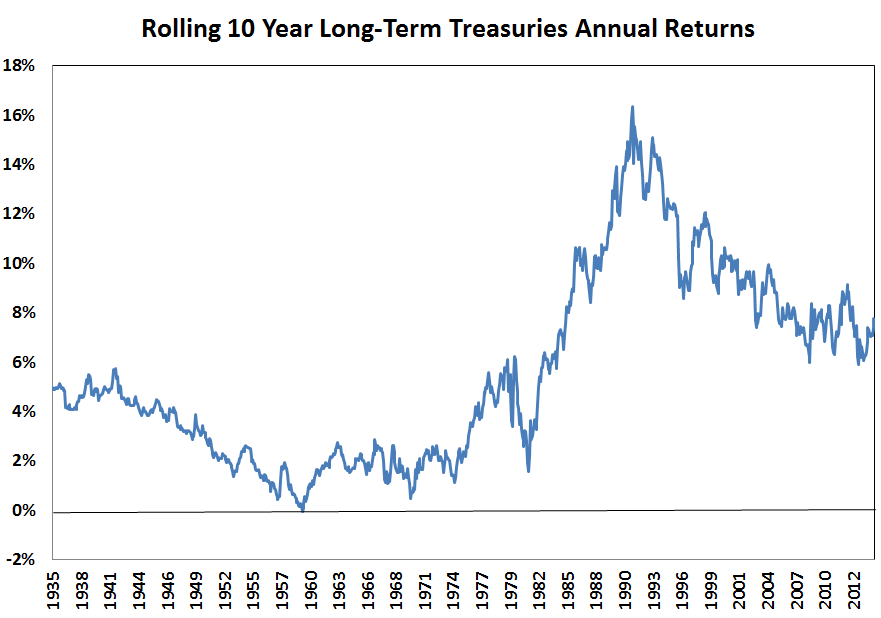
Here are the rolling 10 year annual returns on long-term treasury bonds starting in the late-1920s:
Now take a look at the same graph with the starting bond yield included:
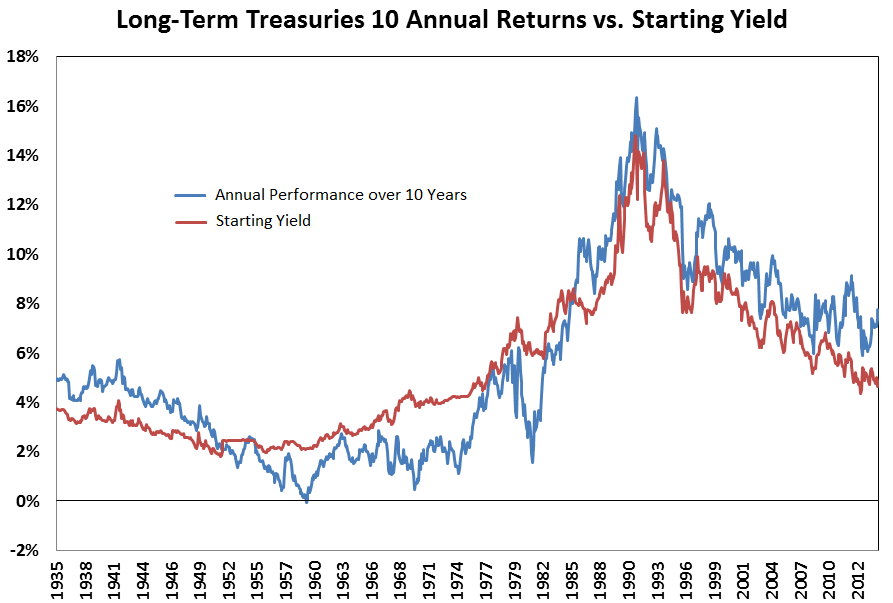 You can see that the two track fairly closely and if you extended these graphs to 20 or 30 years, there would be even less variation between the two. Here’s what I found interesting about this data — there was only one 10 year period with a negative return in bonds (-0.8%/year to be exact, ending in 1959) in almost 90 year’s worth of data. Other than that one time, over any ten year period, long bonds never showed a negative nominal return.
This makes sense given how bonds are structured, but I think many investors miss this point when they worry about the potential risks from rising interest rates. The real risk for bonds, especially at these low yield levels, will almost always come from inflation. These are the rolling 10 year returns for the long bond after-inflation is taken into account:
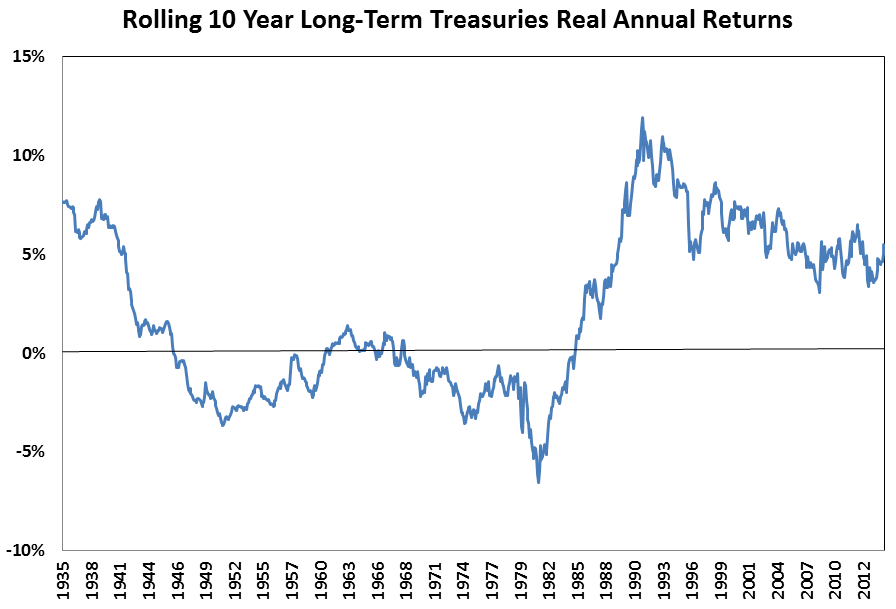
The real returns show that long-term treasuries experienced annual losses over 10 years in over 40% of all rolling periods. On the other hand, over this same time frame, the S&P 500 showed positive after-inflation returns 85% of the time. So more than twice as many decade-long stretches historically have shown negative real returns in bonds than stocks. Again, this makes sense since stocks have proven to be an investor’s best bet to beat inflation over longer time frames.
The other big risk in bonds, and long maturity bonds in particular, is temptation in the short-term. Here’s the one year rolling returns for long-term treasuries:
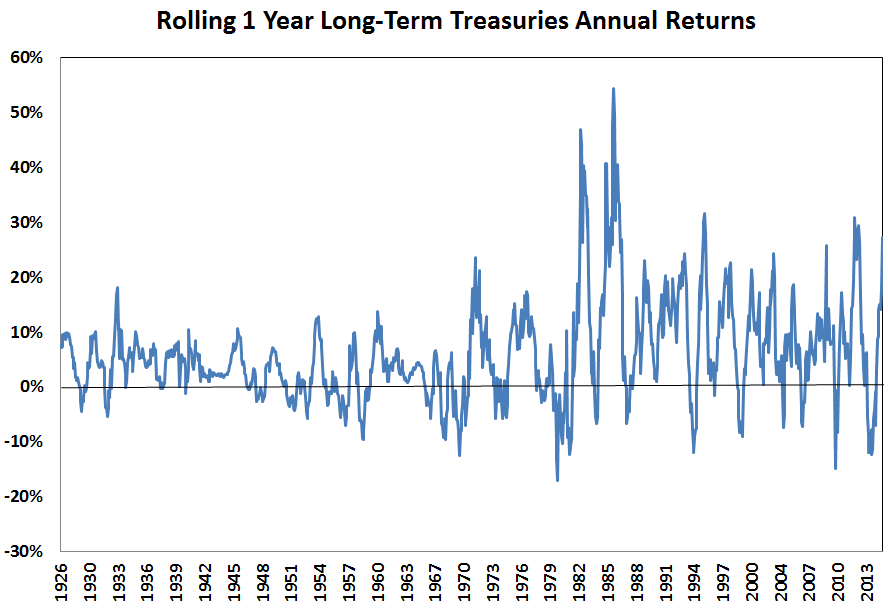
They’re only negative about 22% of the time, but you can see that they’re all over the place. Interest rate expectations are constantly changing over the short-term but over longer periods bond returns are more or less based on math. Trying to game the system by jumping in and out and guessing the direction of interest rates can be a painful experience if you don’t know what you’re doing.
The margin for error from poor timing decisions will be paper thin at current yield levels so it’s best to remember that bonds are supposed to be the boring allocation in your portfolio.
Further Reading:
What Returns Can Investors Expect in Long-Term Treasuries
Are We Witnessing a Melt-Up in Long-Term Bonds?
Subscribe to receive email updates and my monthly newsletter by clicking here.
Follow me on Twitter: @awealthofcs
Copyright © A Wealth of Common Sense