
Manic Depression
by Jeffrey Saut, Chief Investment Strategist, Raymond James
“Manic depression is touching my soul. I know what I want but I just don't know. How to, go about gettin' it. Feeling sweet feeling, drops from my fingers, fingers. Manic depression is catchin' my soul.”
... Jimi Hendrix, Manic Depression, 1967
Mr. Market seems confused. One day he shows up in a jovial mood and the next day he is despondent. Plainly, at least year-to-date, Mr. Market has been manic depressive. I like this story:
Ben Graham, my friend and teacher, long ago described the mental attitude toward market fluctuations that I believe to be most conducive to investment success. He said that you should imagine market quotations as coming from a remarkably accommodating fellow named Mr. Market who is your partner in a private business. Without fail, Mr. Market appears daily and names a price at which he will either buy your interest or sell you his. Even though the business that the two of you own may have economic characteristics that are stable, Mr. Market's quotations will be anything but. For, sad to say, the poor fellow has incurable emotional problems. At times he feels euphoric and can see only the favorable factors affecting the business. When in that mood, he names a very high buy-sell price because he fears that you will snap up his interest and rob him of imminent gains. At other times he is depressed and can see nothing but trouble ahead for both the business and the world. On these occasions he will name a very low price, since he is terrified that you will unload your interest on him.
Mr. Market has another endearing characteristic: He doesn't mind being ignored. If his quotation is uninteresting to you today, he will be back with a new one tomorrow. Transactions are strictly at your option. Under these conditions, the more manic-depressive his behavior, the better for you. But, like Cinderella at the ball, you must heed one warning or everything will turn into pumpkins and mice: Mr. Market is there to serve you, not to guide you. It is his pocketbook, not his wisdom, that you will find useful. If he shows up some day in a particularly foolish mood, you are free to ignore him or to take advantage of him, but it will be disastrous if you fall under his influence. Indeed, if you aren't certain that you understand and can value your business far better than Mr. Market, you don't belong in the game. As they say in poker, "If you've been in the game 30 minutes and you don't know who the patsy is, you're the patsy.”
... [A]n investor will succeed by coupling good business judgment with an ability to insulate his thoughts and behavior from the super-contagious emotions that swirl about the marketplace. In my own efforts to stay insulated, I have found it highly useful to keep Ben's Mr. Market concept firmly in mind.
Warren Buffett’s Letter to Shareholders, 1987 Berkshire Hathaway Annual Report
I particularly like Warren Buffett’s turn of the phrase, “Mr. Market is there to serve you, not to guide you. It is his pocketbook, not his wisdom, that you will find useful. If he shows up some day in a particularly foolish mood, you are free to ignore him or to take advantage of him, but it will be disastrous if you fall under his influence.” To be sure, as I have often written, “Patience is the rarest commodity on Wall Street.” However, it seems investors’ nature has become an “active” one, when at times the best strategy is to be inactive. And, “inactivity” has been our preferred strategy so far this year, consistent with our mantra, “The first few months of 2015 were going to be rocky and more volatile.”
A week ago Friday Mr. Market showed up depressed, leaving the D-J Industrials off some 279 points. The next Monday he was happier, resulting in a 139-point pop. Tuesday, Mr. Worry Wart let the senior index slide ~333 points. Wednesday he was more tempered (-27.55), but the next day Mr. Market was euphoric, producing a Dow Delight of roughly 260 points. That delight took the S&P 500 (SPX/2053.40) above my envisioned 2050 – 2060 overhead resistance zone on an intraday basis, prompting many emails asking, “Hey Jeff, the SPX is at 2066, should we buy this rally?” My responses read, “No, intraday movements are NOT important, it is the closing price that counts.” And sure enough, by the closing bell, the SPX had slipped back below 2060, even if it was only marginally so. Over the weekend I received more emails wanting to know if the SPX was going to make a double-bottom at ~2040 using the intraday “bookend lows” of last Monday and Friday. While markets can certainly do anything, I think the next real support zone is at 1980 – 2000, making the odds for a potential double-bottom at 2040 not tipped far enough in our favor for my liking.
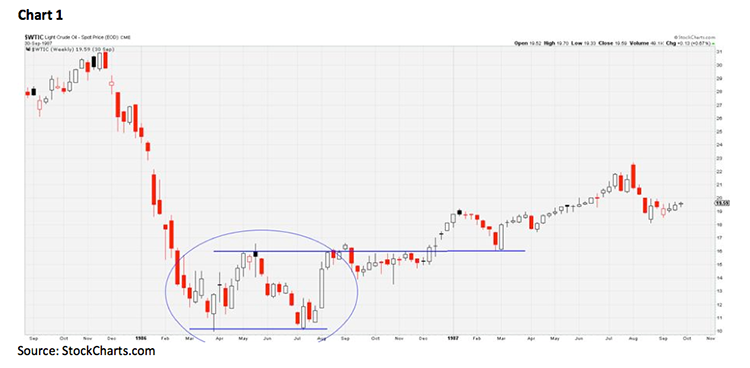
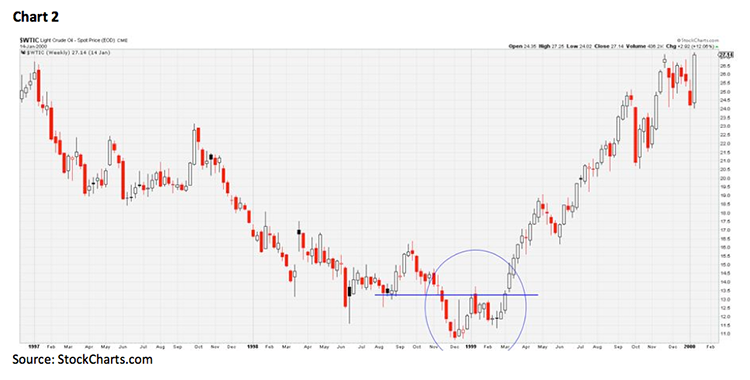
A more interesting question, at least for me, would be, “Is crude oil going to make a double-bottom around the $44 per barrel level?” As noted six weeks ago, I thought oil bottomed with the “undercut low” of $43.58 on January 29th, and I have held to that belief, but last week’s action is calling that view into question. However, 30 years ago (1985 – 1986), after a 60%+ shellacking, it took four months before oil made a double-bottom. And, it was following a 50%+ decline, during the 1997 – 1999 timeframe, that it took three months for oil’s bottom to be completed (see charts on page 3). This week should render an answer to the double-bottom question for both oil and the stock market, provided Mr. Market does not go into snooze mode. In my opinion, the odds of that happening are pretty small given the “call” we made on March 4th that a move of some consequence was getting ready to occur based on the narrowness of the Bollinger Bands and the buildup of the stock market’s internal energy (see those attached comments on page 3).
For me, it has always been amazing how the news FOLLOWS the price action of the markets, not vice-a-versa. To wit, last week: 1) U.S. sales dropped 2%, and are now off four months in a row; 2) the University of Michigan March Confidence Index missed, at 91.2 versus 95.4 in the previous month; 3) Refinance applications fell by 2.9% week-over-week as the 30-year mortgage rate rose to 4.01%; 4) Retail Sales (x-gasoline and autos) fell by 0.2%; and 5) U.S. business inventory growth was flat. Such reports brought about cries of deflation. Speaking to the alleged deflation thesis, last week my friends at Bloomberg wrote, “Here's one sign of the U.S. economic recovery that few Americans will rejoice over, the average cost of a wedding just hit a five-year high.” However, as the must have service of Joan McCullough notes about the Bloomberg article:
[The] Upshot: average wedding spending is now at $31.2k. The return of big-budget weddings may be one sign that the U.S. consumer is finding her economic footing again following the biggest recession in the post-World War II era. ... Spending per head was at its highest level since the company began surveying brides in 2007, as the size of the average guest list shrank to 136 people, the lowest on record! WTF? [Says Joan], they [Bloomberg] just threw that in there. And I’ll bet they didn’t even realize what they just revealed. Namely, this: That the bride’s $31,200 U.S. dollars do not buy what they used to buy! Spending Up; Guest list down; Puh-leez. Point made? Thank you very much.
And that, dear reader, is a GREAT insight.
The call for this week: Deflation is, and always has been, a bad bet! Deflation in equity prices is another thing because pullbacks occur frequently. We have experienced such “price deflations” a number of times since the secular bull market began six years ago. In 2010 the SPX had a 17.1% decline, in 2011 there was 21.6% drawdown, and in 2012 we saw a 10.9% haircut. Since June 2012, however, we have only experienced one haircut even close to 10% and that was the 9.8% affair that ended on October 15th of last year. Whether the current intraday pullback of 3.8% turns into something of significance remains to be seen, but this week should go a long way in telling us. Indeed, Friday represents a triple-witch where stock options, futures, and futures options all expire on the same day. Triple-witch weeks tend to have increased volatility, especially when combined with a FOMC meeting, yet I don’t know how much more volatility we can take. As stated, if the SPX doesn’t form a double-bottom at 2040, the next support zone is 1980 – 2000. This morning, however, Mr. Market seems happy with the dollar and oil lower, while The Wall Street Journal waxes of a deal with Iran. Those metrics have the preopening S&P futures up ~10 points despite Russia’s “snap” military action in the Arctic. Still, overhead resistance remains in the 2050 – 2060 zone. But remember, “Mr. Market has another endearing characteristic: He doesn't mind being ignored.”
Excerpt from the Morning Tack (3/4/15)
I revisit these inflection points this morning not because the NASDAQ has tagged 5000, but because near each one of those inflection points the Bollinger Bands have narrowed. According to Investopedia, “Because standard deviation is a measure of volatility, Bollinger Bands® adjust themselves to the market conditions. When the markets become more volatile, the bands widen, and during less volatile periods, the bands contract. The tightening of the bands is often used by technical traders as an early indication that the volatility is about to increase sharply.” This narrowing happened at the beginning of 2013 right before the S&P 500 (SPX/2107.78) started its “moonshot” coincident with a Dow Theory “buy signal;” and, it happened in late-2007 coincident a Dow Theory “sell signal.” Well, it has just happened again with the Bollinger Bands at their narrowest since late-2007. Unfortunately, the “bands” do not tell us which way the markets are going to move, but that a move of some consequence is coming.
Copyright © Raymond James