With all of the Commodity movement recently, for this week's SIA Equity Leaders Weekly we are going to take a closer look in at Canadian Equity on both a dividend and non-dividend adjusted basis to see where the markets are trending.
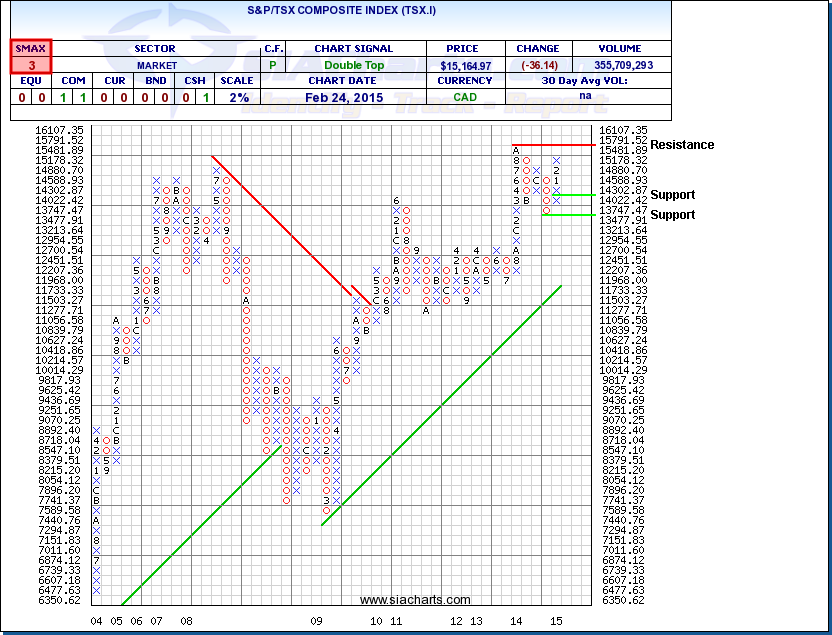
S&P/TSX Composite Index (TSX.I)
The S&P/TSX Composite Index hit it all-time high back in September of last year, and since then, there has been some indecisive back and forth activity. Most recently, the Index has been rallying in attempt to get back to its prior high, but there is still a small bit of room left to move before the resistance level up at 15791.52 comes into play. To the downside, support for the TSX.I is found at around 14000 and below this at the low from last year at 13477.91
What is interesting to note is that we are seeing this upwards move come when both Gold and Oil have not really helped the strength. Year to date the TSX.I is up over 3,5%, GC.F (Gold Futures) is up a little over 1%, and CL.F (Crude Oil Futures) is down 7.5%.
Click on Image to Enlarge
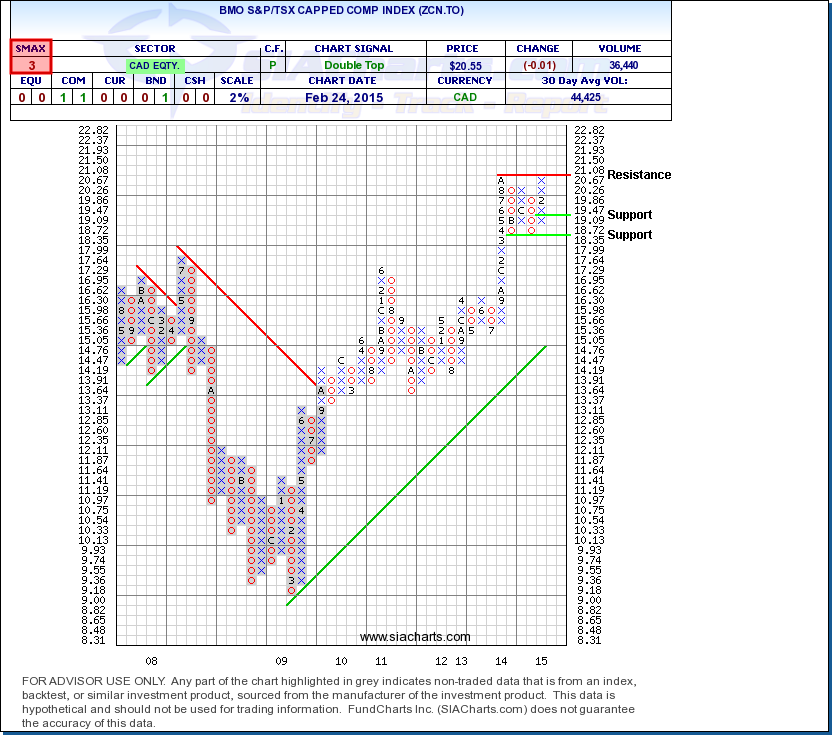
BMO S&P/TSX Capped Composite Index (ZCN.TO)
Looking at our next chart, when we add in the dividends we can see that ZCN.TO is back up against the all-time high resistance level at $21.08 already. We can also see that this ETF has started to create a channel between that high and a low of $18.35, with both levels being touched twice now. Year to date, ZCN.TO is up 4.2% so far. The short-term outlook is still showing only a SMAX score of 3 out of 10 as the major resistance level at $21.08 should be monitored closely for possible break through or another reversal.
Despite a lack of help from the major Canadian Commodities, Canada is actually showing a decent amount of strength to start the year. Just make sure you stay up in the strength!
P.S. - Our Hypothetical SIA 5 Stock TSX 60 model is up 14.85% YTD and our Hypothetical SIA 15 Stock CAD Growth and Income model is up 9% so far for the year!
Click on Image to Enlarge
SIACharts.com specifically represents that it does not give investment advice or advocate the purchase or sale of any security or investment. None of the information contained in this website or document constitutes an offer to sell or the solicitation of an offer to buy any security or other investment or an offer to provide investment services of any kind. Neither SIACharts.com (FundCharts Inc.) nor its third party content providers shall be liable for any errors, inaccuracies or delays in content, or for any actions taken in reliance thereon.
Any questions or to learn more about these example models, please call or email us at 1-877-668-1332 or siateam@siacharts.com.
Copyright © SIACharts.com