by Dana Lyons, JLFMI Blog
In early December, we took a look at a variation of the notorious “Hindenburg Omen”, a supposed signal of forthcoming trouble in the market. For those unfamiliar with it, among other variables the Hindenburg Omen relates to conditions in the market when there are a significant number of New Highs AND New Lows. The indicator has been the subject of a fair amount of derision over the years, owing partly to its complicated set of criteria as well as a number of false signals. That said, an examination into its track record yields legitimate evidence of its effectiveness as a warning sign, despite its false signals (what indicator doesn’t have those?).
Our study had a simple set of criteria so as to avoid the data-mining trap. We simply looked at occasions in which the number of NYSE New Highs and New Lows each constituted more than 4% of all issues traded on a particular day. (For fun, we gave the signal the moniker, “Akron Omen”. This choice was both to shy away from alarmist-sounding names, like Hindenburg, as well as to pay respect to the USS Akron, a helium-filled airship that crashed in 1933, killing 73 airmen, twice the number of casualties as the Hindenburg.)
We mention it again today because there have been a few new sightings this week of the Akron Omen.

Monday, Tuesday and Wednesday all saw New Highs and New Lows reach more than 4% of all NYSE issues. You might be thinking "so what?" Well, since 1970, there have been just 30 such instances out of over 11,000 days. That equals one quarter of one percent of all days. It is pretty noteworthy that 3 out of 30 occurrences in 45 years happened in 1 week. Furthermore, that makes 9 now in just the last 6 weeks!
So this is extremely unusual, but again, “so what?” The “so what” is that things did not work out too well for stocks following previous occurrences. Here are the returns for the S&P 500 following such occurrences since 1970.
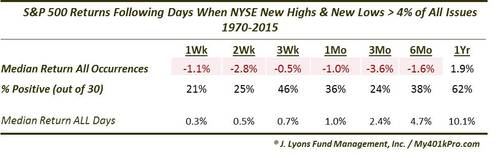
Short, intermediate and long-term returns were all well below normal. 2 weeks later, 21 of the 28 occurrences showed a negative return in the S&P 500, including 5 of the 6 this past November and December. The median return was -2.8%. In the intermediate-term, things were not much better. 3 months later, 16 out of 21 (recent occurrences don’t have enough data yet) were down with a median return of -3.6%. And while the median 1-year return was positive at 1.9%, it was well below the median of all days of +10.1%. Furthermore, the average 2-year drawdown (not shown) was over -25%. That gives you an indication of the types of markets in which these conditions arise.
One subset of these days that we didn’t look at in the December post is when the number of New Lows exceeded the number of New Highs on these days. Of the 30 total events, 12 of them saw more New Lows than New Highs, including December 1 and 8 as well as this past Wednesday. Although it is an especially small sample size, for what it’s worth returns going forward were even worse than the poor results following all events.
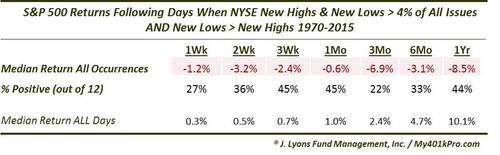
2-week, 3-month and 1-year median returns were -3.2%, -6.9% and -8.5%, respectively. Small sample size or not, that is pretty poor.
What is the dynamic that gives rise to these conditions? We’re not sure but we’ll offer up one theory. The growing number of New Lows indicates a weakening market, with a significant number of issues beginning to break down. Meanwhile, the abundance of New Highs is an indication that the market is perhaps in the topping/transition phase as a number of areas continue to perform reasonably well. The fact that various segments of the market continue to hit new highs gives the perception that the broad market is still on firm footing. As long as something is still going up, the reasoning goes, the market cannot be in too much trouble. This gives many investors comfort in remaining heavily invested in both the areas doing well as well as the broad market in general. This simply sets up participants for maximum pain IF those weakening areas ultimately have a greater impact on the broad market. Once the broad market does break down, investors, being fully invested, are caught off guard and subject to major drawdowns. As they are then forced to reduce their heavy exposure, losses in the equity market are subject to “snowballing”.
Whether or not that thesis is correct, we don’t know for sure. It makes sense to us and, considering investor allocations at the present time, such conditions seem to be in place. Whether events unfold accordingly is also to be determined. However, the track record following “Akron Omen” conditions is extremely dubious and — whatever the reason for it — it probably merits some attention.
________
Photo of the Maiden voyage of the USS Akron
About Dana Lyons
Dana Lyons is a partner at J. Lyons Fund Management, Inc., a Registered Investment Advisor and founder of My401kPro.com. He is a veteran of nearly 20 years in the investment industry as a portfolio manager, analyst and commodities trader and is an original Yahoo Finance Contributor. Dana has a Bachelor of Science degree in Economics with a major in Finance from the Wharton School of Business at the University of Pennsylvania where he was also an All-Ivy League football player. He lives in Chicago with his wife, Dana (seriously, same name) and 3 children. (DL: “Our oldest child is 3…did I mention I’m a manager and not a planner?”)
Copyright © Dana Lyons, JLFMI Blog