by Eddy Elfenbein, Crossing Wall Street
Lately, I’ve been doing some unusual projects with market data. Here’s the latest one I wanted to share with you.
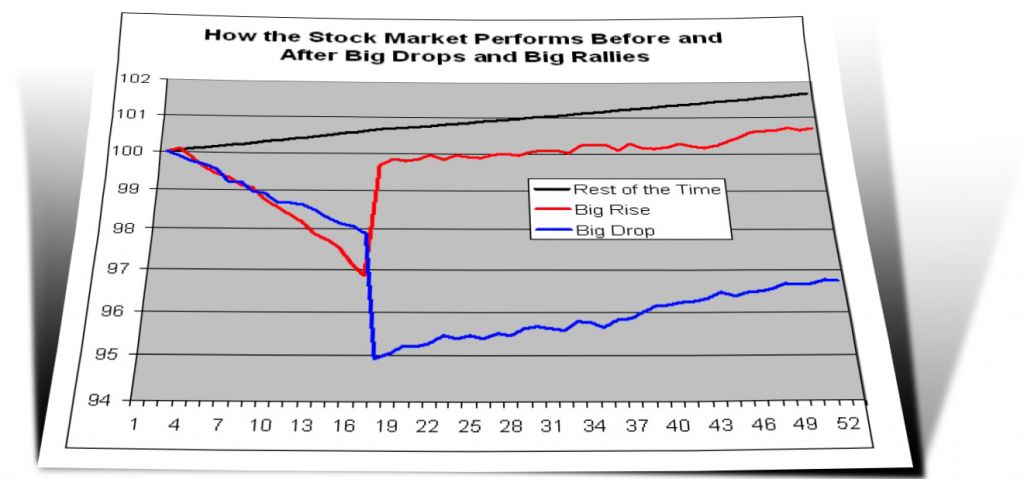
I wanted to see if there’s a pattern the S&P 500 exhibits before and after major price moves. To do this, I took all of the S&P 500 daily changes since 1950. I then selected out all the days when the market fell by more than 2%, rose by more than 2% and everything else.
Historically, the market has risen by 2% or more in a single day, on average, once every two months. It’s nearly identical for 2% daily rallies. I then included how the market did on the 16 days prior to each big rise or fall, plus the subsequent 35 days.
The blue line shows that the stock market slides into a big drop, but rallies afterward.
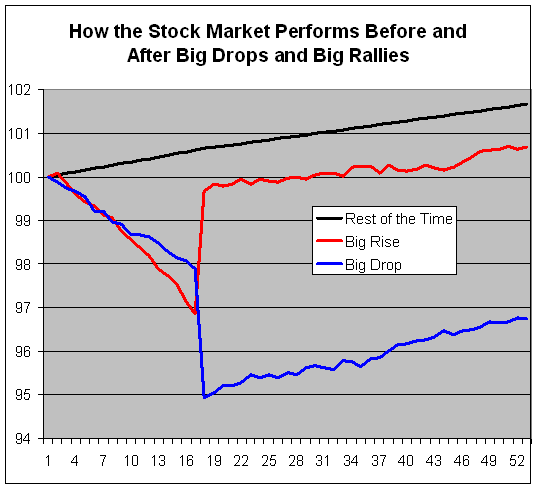
What surprised me was the red line. It shows that the S&P 500 also slides into big jumps. In fact, the slide is a bit more pronounced than the blue line. Yet again, the market rallies after the big leap upward. The rally is slightly weaker than the blue line’s rally.
The black is all of the rest of the time, which is about 96% of the time. It barely moves. The rest of the time, the stock market gradually climbs.
I think this underscores an important point about financial markets. Markets tend to move between long periods of stability and short periods of great instability.
Copyright © Eddy Elfenbein