by Don Vialoux, EquityClock.com
Pre-opening Comments for Tuesday October 14th
U.S. equity index futures were higher this morning following the sharp downdraft during the last two hours of trading yesterday. S&P 500 futures were up 15 points in pre-opening trade.
Canadian equities are expected to open lower reflecting weakness yesterday in world equity markets.
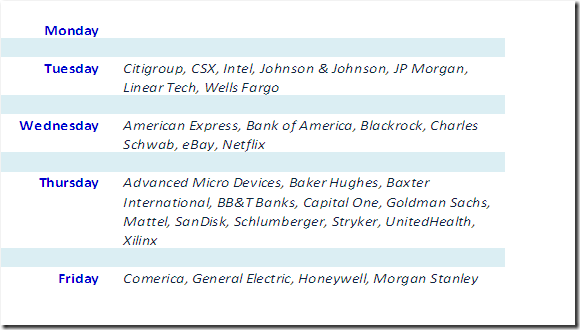
Third quarter earnings reports started to flood in. Companies that reported this morning included JP Morgan, Dominos, Johnson & Johnson, Citigroup and Wells Fargo.
Alibaba added $0.73 to $85.85 after UBS initiated coverage with a Buy rating and a $100 target.
Ford (F $13.58) is expected to open lower after Goldman Sachs downgraded the stock from Buy to Neutral.
Corning dropped $0.15 to $17.49 after Bank of America downgraded the stock from Buy to Neutral. Target is $20.
Netflix added $6.95 to $445.53 after BTIG Research upgraded the stock from Neutral to Buy. Target is $600.
Lear Corp fell $0.39 to $80.50 after Goldman Sachs downgraded the stock from Buy to Neutral.
EquityClock.com’s Daily Market Comment
Following is a link:
http://www.equityclock.com/2014/10/14/stock-market-outlook-for-october-14-2014/
Interesting Study on Performance of the S&P 500 after breaking below its 200 day moving average
The following study was released on CNBC last night:
http://www.cnbc.com/id/102083856?trknav=homestack:topnews:4
Update
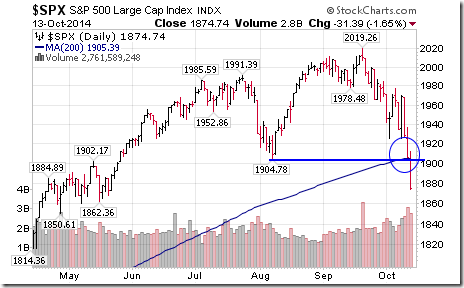
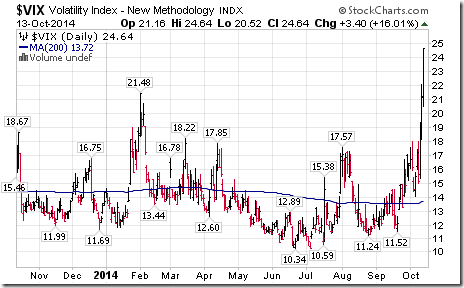
U.S. equity markets had another wild day yesterday! The S&P 500 Index dropped 31.39 points and the Dow Jones Industrial Average plunged 223.03 points. All of the drops happened during the last two trading hours. Several key technical were recorded:
· The S&P 500 and Dow Industrials closed below their 200 day moving average
· Both indices fell below previous trading support levels
· The VIX Index spiked
· 40 S&P 500 stocks broke intermediate support levels.
In addition, the U.S. Dollar Index plunged 0.87after the close.
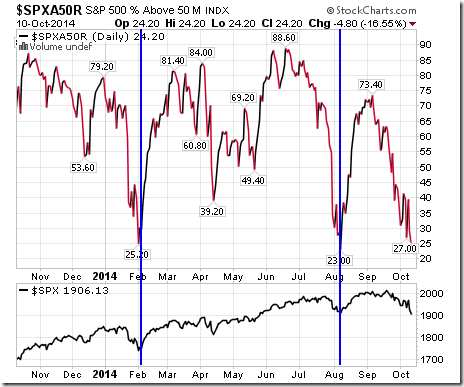
Percent of S&P 500 stocks trading above their 50 day moving average fell to 16.4%. Although deeply oversold, Percent has yet to show signs of bottoming.
Economic News This Week
September Retail Sales to be released at 8:30 AM EDT on Wednesday are expected to decline 0.1% versus a gain of 0.6% in August. Excluding auto sales, September Retail Sales are expected to increase 0.3% versus a gain of 0.3% in August.
September Producer Prices to be released at 8:30 AM EDT on Wednesday are expected to increase 0.1% versus no change in the month of August. Excluding food and energy September PPI is expected to increase 0.1% versus a 0.1% gain in August.
October Empire Manufacturing Index to be released at 8:30 AM EDT on Wednesday is expected to decline to 20.0 from 27.5 in September.
August Business Inventories to be released at 10:00 AM EDT on Wednesday are expected to increase 0.4% versus a gain of 0.4% in July.
Fed Beige Book is scheduled to be released at 2:00 AM EDT on Wednesday
Weekly Jobless Claims to be released at 8:30 AM EDT on Thursday are expected to increase to 290,000 from 287,000 last week.
September Industrial Production to be released at 9:15 AM EDT on Thursday is expected to increase 0.4$ versus a decline of 0.1% in August. September Capacity Utilization is expected to increase to 79.0% from 78.8% in August.
October Philadelphia Fed to be released at 10:00 AM EDT on Thursday is expected to slip to 20.0 from 22.5 in September.
September Housing Starts to be released at 8:30 AM EDT on Friday are expected to increase to 1,022,000 units from 956,000 in August.
September Canadian Consumer Prices to be released at 8:30 AM EDT on Friday are expected to increase 0.1% versus no change in August. On a year over year basis, September CPI is expected to be up 2.1%.
Michigan Sentiment Index to be released at 9:55 AM EDT on Friday is expected to slip to 84.0 from 84.6 in September
Earnings News This Week
Equity Trends
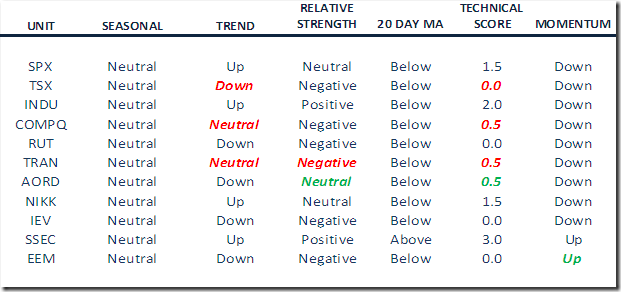
Summary of Weekly Seasonal/Technical Parameters for Equity Indices/ETFs
Key:
Seasonal: Positive, Negative or Neutral on a relative basis applying EquityClock.com charts
Trend: Up, Down or Neutral
Strength relative to the S&P 500 Index: Positive, Negative or Neutral
Momentum based on an average of Stochastics, RSI and MACD: Up, Down or Mixed
Green: Upgrade
Red: Downgrade
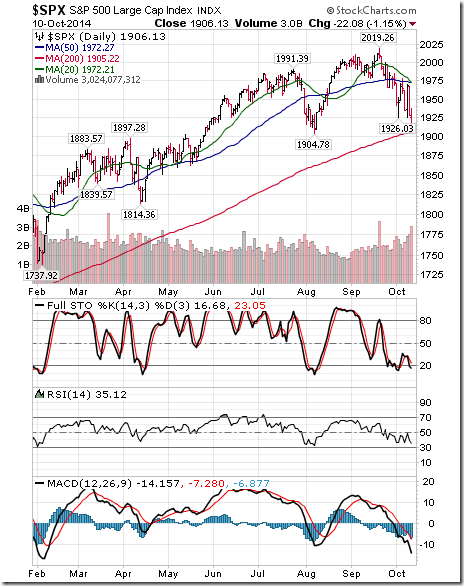
The S&P 500 Index fell 61.77 points (3.14%) last week. Intermediate trend remains up. The Index remains below its 20 day moving average. The Index is testing its 200 day moving average. Short term momentum indicators are trending down, but are oversold.
Percent of S&P 500 stocks trading above their 50 day moving average dropped to 24.20% from 41.60%. Percent is trending down and is intermediate oversold, but has yet to show signs of bottoming. Historically, the S&P 500 Index has started an intermediate uptrend when Percent falls below 30% and starts to recover.
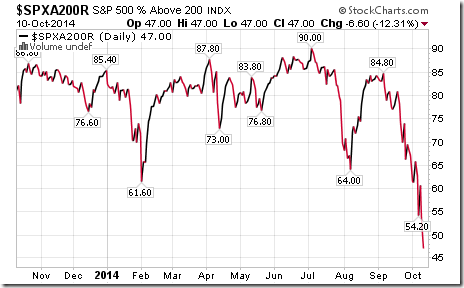
Percent of S&P 500 stocks trading above their 200 day moving average dropped to 47.00% from 65.80%. Percent continues to trend lower.
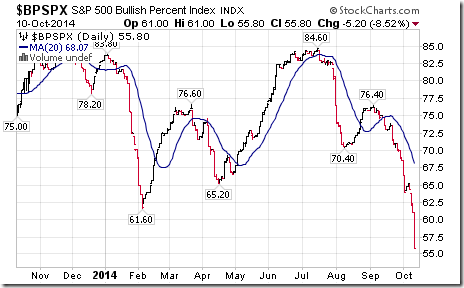
Bullish Percent Index for S&P 500 stocks plunged to 55.80% from 64.80% and remained below its 20 day moving average. The Index continues to trend down.
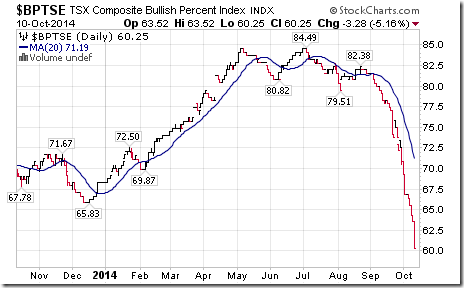
Bullish Percent Index for TSX Composite stocks dropped to 60.25% from 66.80% and remained below its 20 day moving average. The Index continues to trend down.
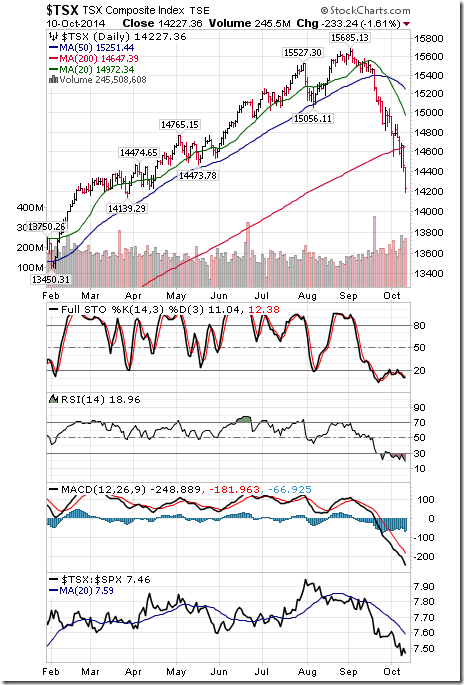
The TSX Composite Index plunged 562.42 points (3.80%) last week. Intermediate trend changed from neutral to negative on a move below 14,473.78 (Score: 0.0). The Index has declined 9.3% from its September 3rd high. The Index remains below its 20 day moving average (Score: 0.0) and fell below its 200 day moving average. Short term momentum indicators are trending down, but are deeply oversold. Technical score slipped to 0.0 from 0.5.
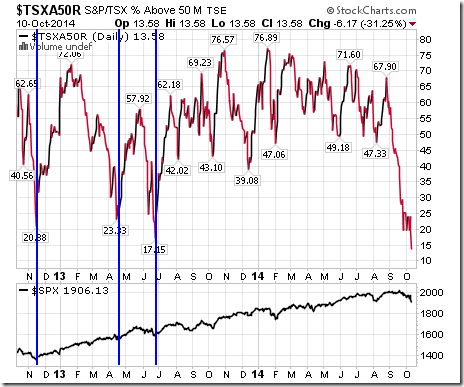
Percent of TSX stocks trading above their 50 day moving average dropped to 13.58% from 23.87%, the lowest level since October 2011. Trend remains down, but is setting up for a bottoming and start of an intermediate uptrend. Not there yet!
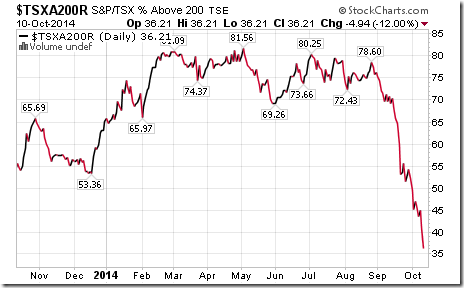
Percent of TSX stocks trading above their 200 day moving average fell to 36.21% from 46.91% last week. Percent continues to trend down.
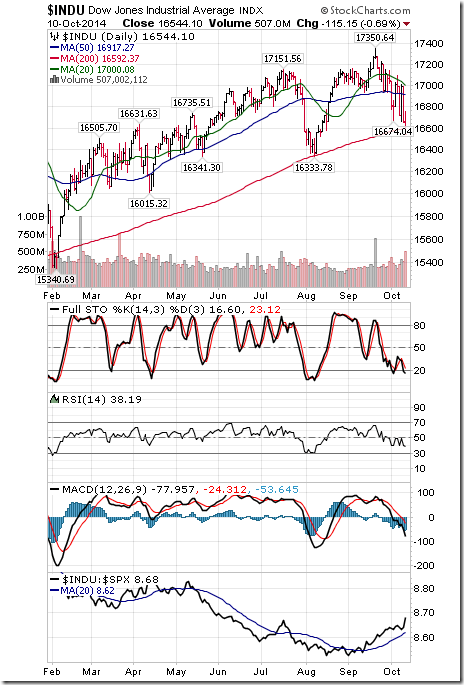
The Dow Jones Industrial Average plunged 465.59 points (2.74%) last week. Intermediate trend remains up. The Average remains below its 20 day moving average. Strength relative to the S&P 500 Index remains positive. Technical score remains at 2.0 out of 3.0. Short term momentum indicators are trending down and are oversold.
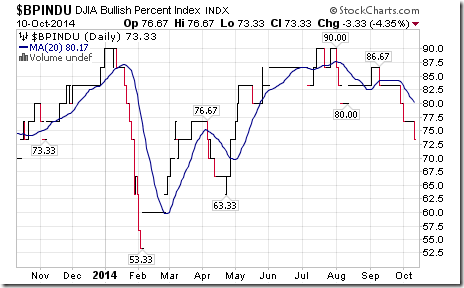
Bullish Percent Index dropped to 73.33% from 76.67% last week and remained below its 20 day moving average. The Index remains intermediate overbought and is trending down.
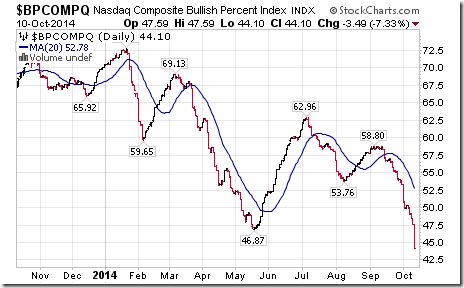
Bullish Percent Index for NASDAQ Composite stocks dropped to 44.10% from 50.26% and remained below its 20 day moving average. The Index remains in an intermediate downtrend.
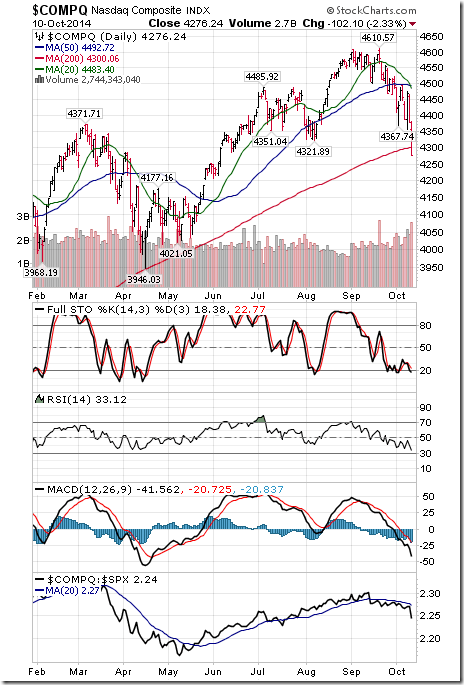
The NASDAQ Composite Index plunged 199.38 points (4.45%) last week. Intermediate trend changed to neutral from up on a move below 4,321.89. The Index remains below its 20 day moving average. Strength relative to the S&P 500 Index remains negative. Technical score slipped to 0.5 from 1.0 out of 3.0. Short term momentum indicators are trending down, but are oversold.
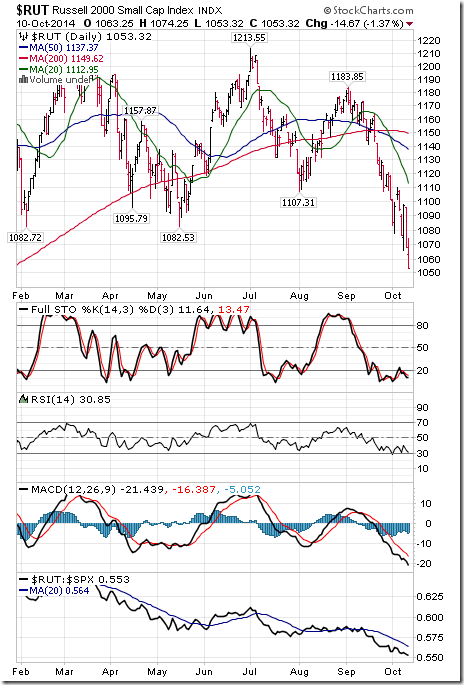
The Russell 2000 Index plunged another 51.42 points (4.65%) last week. Intermediate trend remains down. The Index remains below its 20 day moving average. Strength relative to the S&P 500 remains negative. Technical score remains at 0.0 out of 3.0. Short term momentum indicators are trending down, but are oversold.
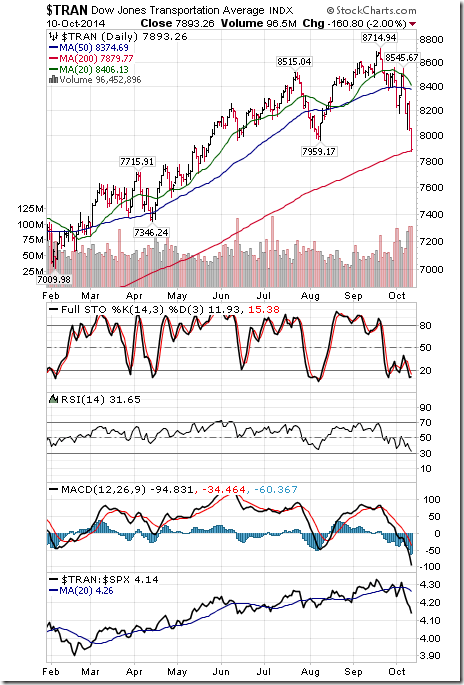
The Dow Jones Transportation Average plunged 588.73 points (6.94%) last week. Intermediate trend changed to neutral from up on a move below 7,959.17. The Average remains below its 20 day moving average. Strength relative to the S&P 500 Index changed to negative from neutral. Technical score dropped to 0.5 from 1.5 out of 3.0. Short term momentum indicators are trending down, but are oversold.
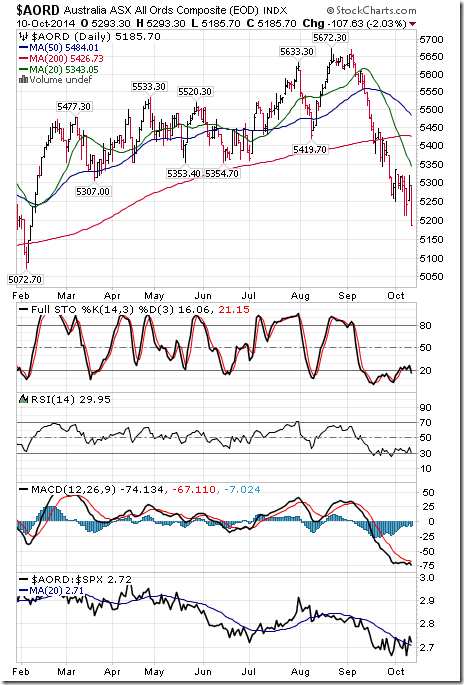
The Australia All Ordinaries Composite Index fell 129.70 points (2.44%) last week. Intermediate trend remains down. The Index remains below its 20 day moving average. Strength relative to the S&P 500 Index changed to neutral from negative. Technical score improved to 0.5 from 0.0 out of 3.0. Short term momentum indicators are trending down, but are showing early signs of bottoming.
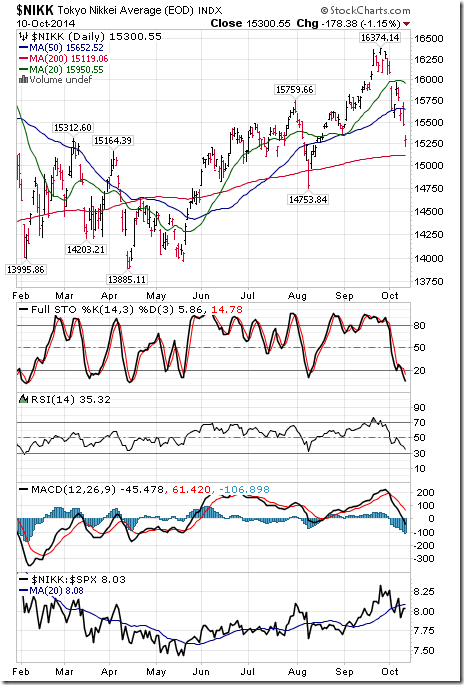
The Nikkei Average dropped 408.10 points (2.60%) last week. Intermediate trend remains up. The Average remains below its 20 day moving average. Strength relative to the S&P 500 Index remains neutral. Technical score remains at 1.5 out of 3.0. Short term momentum indicators are trending down.
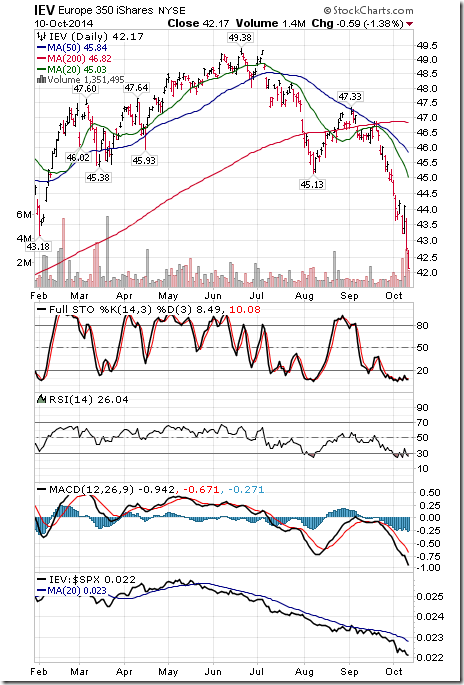
iShares Europe 350 dropped another $1.65 (3.77%) last week. Intermediate trend remains down. Units remain below their 20 day moving average. Strength relative to the S&P 500 Index remains negative. Technical score remains at 0.0 out of 3.0. Short term momentum indicators are trending down, but are oversold.
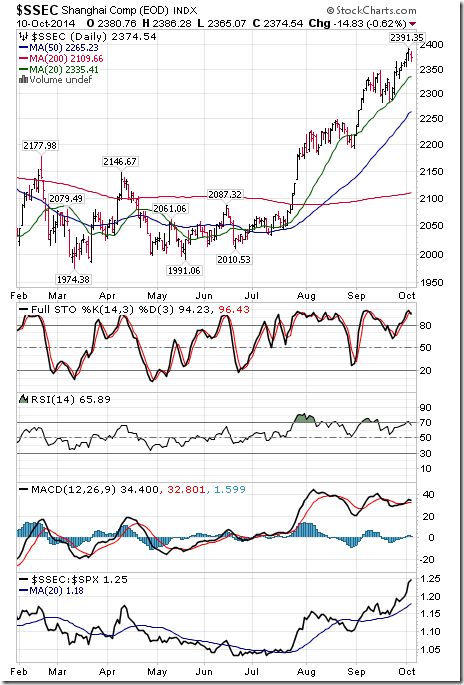
The Shanghai Composite Index added 10.67 points (0.45%) last week. Intermediate trend remains up. The Index remains above its 20 day moving average. Strength relative to the S&P 500 Index remains positive. Technical score remains at 3.0 out of 3.0. Short term momentum indicators are trending up, but are overbought.
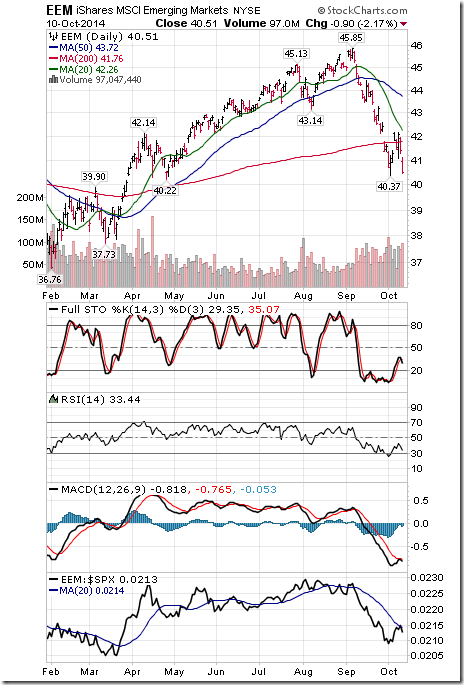
iShares Emerging Markets dropped $0.77 (1.87%) last week. Intermediate trend remains down. Units remain below their 20 day moving average. Strength relative to the S&P 500 Index remains down. Technical score remains at 0.0 out of 3.0. Short term momentum indicators are oversold and showing early signs of recovery.
Currencies
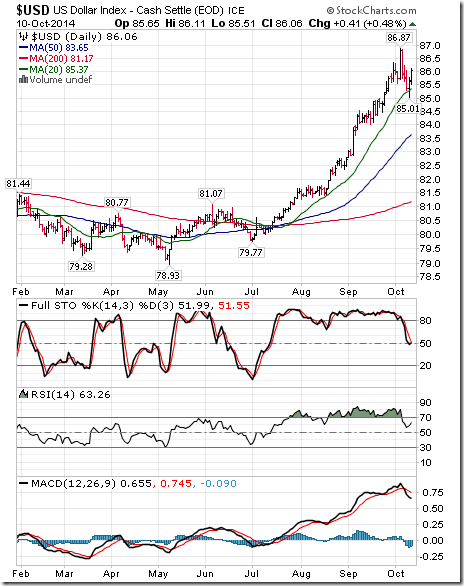
The U.S. Dollar Index fell 0.75 (0.86%) last week. Intermediate trend remains up. The Index remains above its 20 day moving average. Short term momentum indicators have rolled over from overbought levels and are trending down.
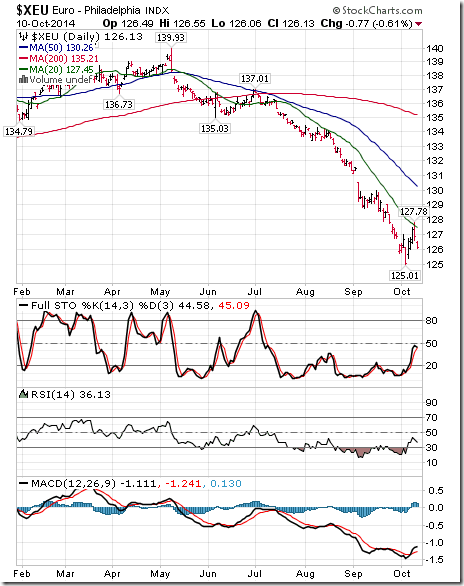
The Euro added 0.98 (0.78%) last week. Intermediate trend remains down. The Euro remains below its 20 day moving average. Short term momentum indicators are recovering from oversold levels.
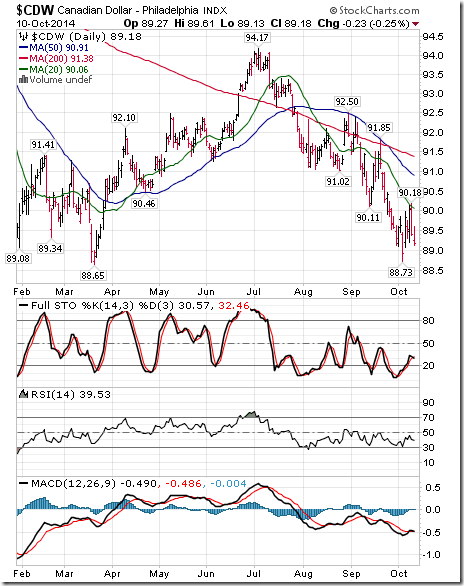
The Canadian Dollar added US 0.34 cents (0.38%) last week. Intermediate trend remains down. The Canuck Buck remains below its 20 day moving average. Short term momentum indicators are mixed.
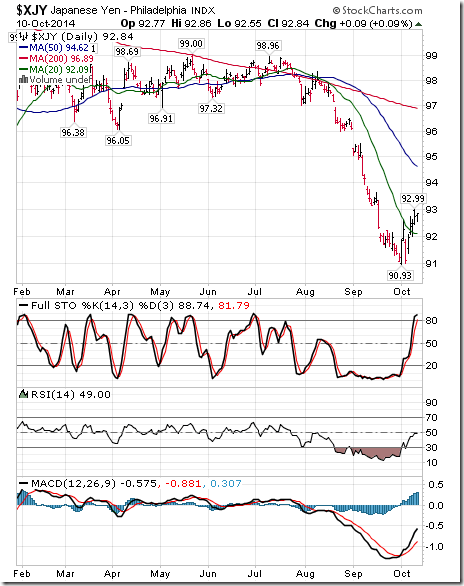
The Japanese Yen added 1.71 (1.88%) last week. Intermediate trend remains down. The Yen moved above its 20 day moving average. Short term momentum indicators are trending up.
Commodities
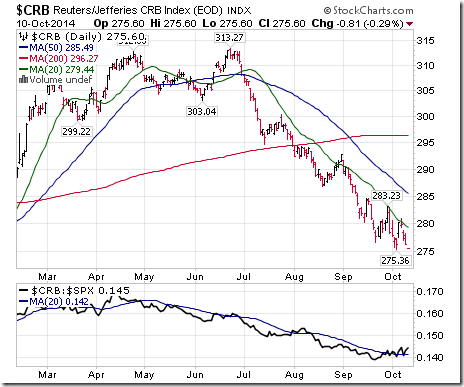
The CRB Index slipped 1.72 points (0.62%) last week. Intermediate trend remains down. The Index remains below its 20 day moving average. Strength relative to the S&P 500 Index changed to positive from neutral. Technical score improved to 1.0 from 0.5 out of 3.0.
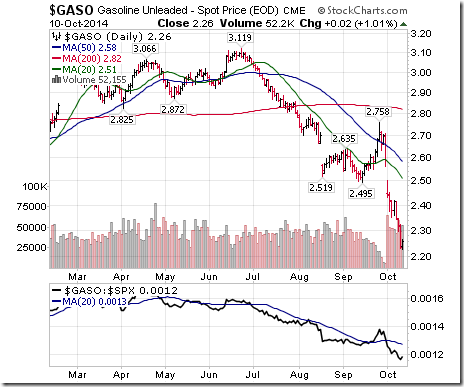
Gasoline plunged $0.12 per gallon (5.04%) last week. Intermediate trend remains down. Gas remains below its 20 day moving average. Strength relative to the S&P 500 Index remains negative. Technical score remains at 0.0 out of 3.0.
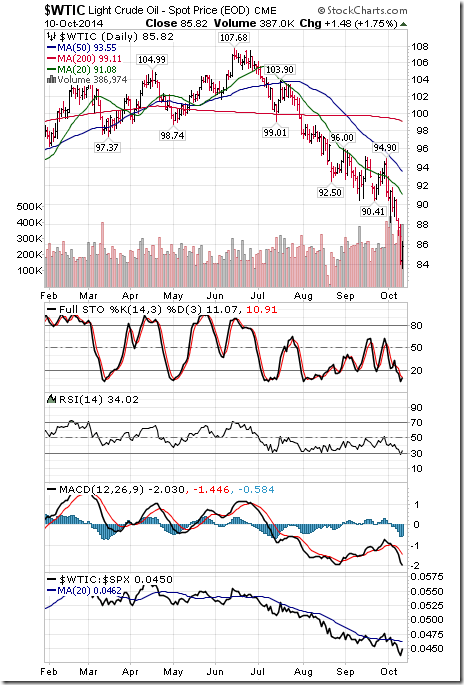
Crude Oil dropped another $3.92 per barrel (4.37%) last week. Intermediate trend remains down. Crude remains below its 20 day moving average. Strength relative to the S&P 500 Index remains negative. Technical score remains at 0.0 out of 3.0. Short term momentum indicators are trending down, but are oversold.
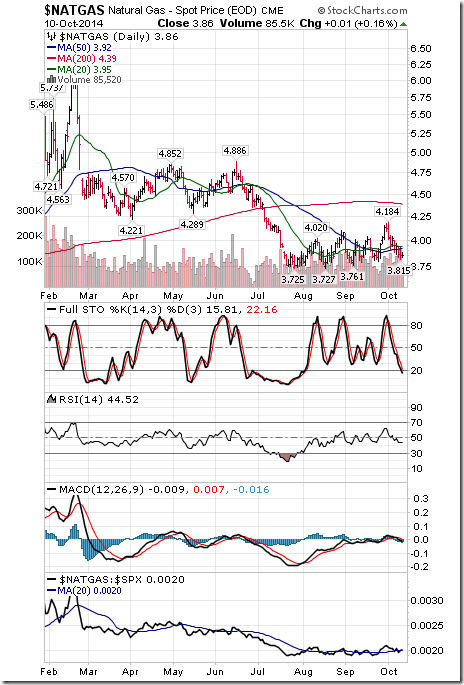
Natural Gas fell $0.18 (4.45%) last week. Intermediate trend remains up. “Natty” fell below its 20 day moving average. Strength relative to the S&P 500 Index changed to neutral from positive. Technical score fell to 1.5 from 3.0 out of 3.0. Short term momentum indicators are trending down.
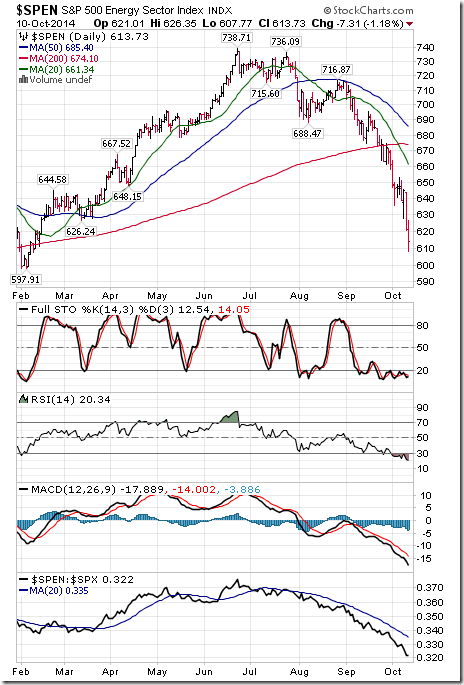
The S&P Energy Index plunged 32.53 points (5.03%) last week. Intermediate trend remains down. The Index remains below its 20 day moving average. Strength relative to the S&P 500 Index remains negative. Technical score remains at 0.0 out of 3.0. Short term momentum indicators are trending down, but are oversold.
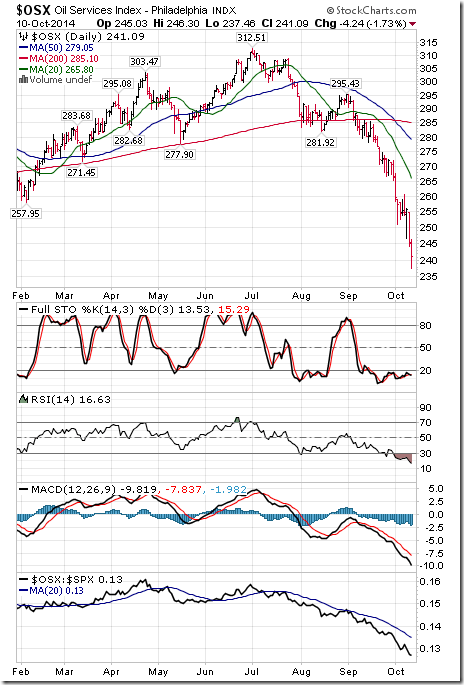
The Philadelphia Oil Services Index plunged 13.50 points (5.30%) last week. Intermediate trend remains down. The Index remains below its 20 day moving average. Strength relative to the S&P 500 Index remains negative. Short term momentum indicators are trending down and are deeply oversold.
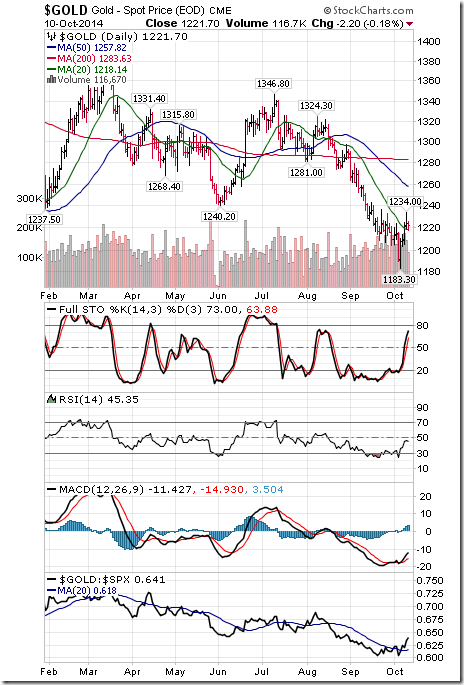
Gold gained $28.80 per ounce (2.41%) last week. Intermediate trend remains down. Gold moved above its 20 day moving average. Strength relative to the S&P 500 Index changed from negative to positive. Technical score improved to 2.0 from 0.0 out of 3.0. Short term momentum indicators are trending up.
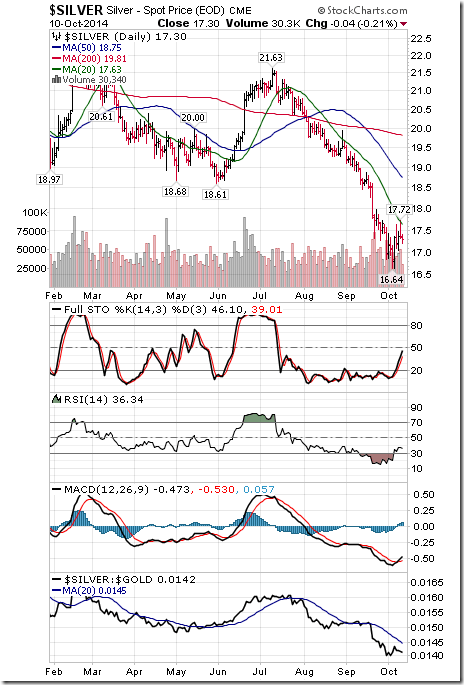
Silver added $0.47 per ounce (2.79%) last week. Intermediate trend remains down. Silver remains below its 20 day moving average. Strength relative to the S&P 500 Index changed from negative to positive. Technical score improved to 1.0 from 0.0 out of 3.0. Strength relative to Gold remains negative. Short term momentum indicators are trending up.
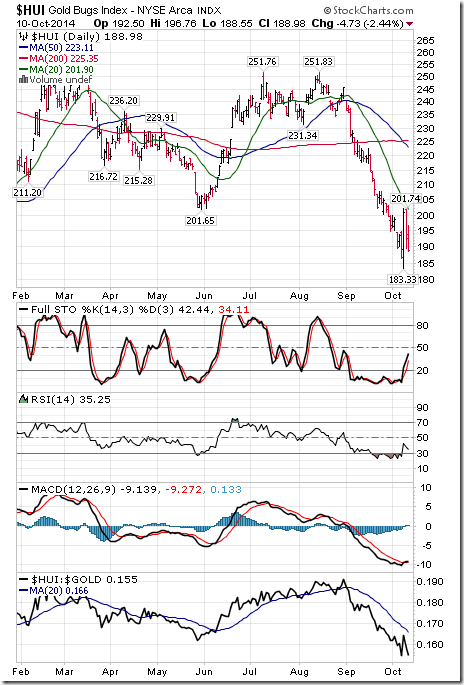
The AMEX Gold Bug Index slipped 0.79 points (0.42%) last week. Intermediate trend remains down. The Index remains below its 20 day moving average. Strength relative to the S&P 500 Index remains negative. Technical score remains at 0.0 out of 3.0. Strength relative to Gold remains negative. Short term momentum indicators are recovering from oversold levels.
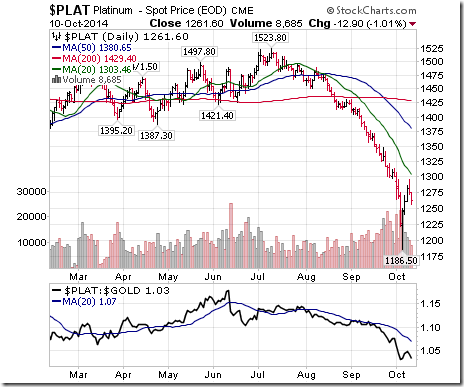
Platinum gained $34.70 per ounce (2.83%) last week. Trend remains down. PLAT remains below its 20 day moving average. Strength relative to S&P changed to neutral from negative.
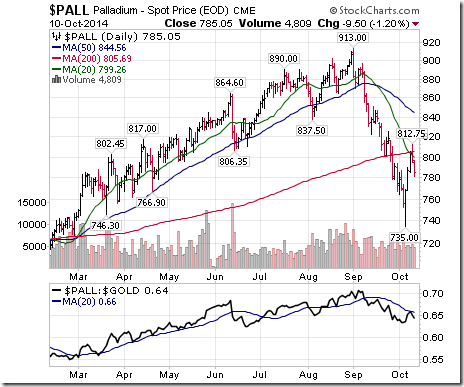
Palladium gained $30.50 per ounce (4.04%) last week. Intermediate trend remains down. PALL remains below its 20 day moving averages. Strength relative to the S&P 500 changed from negative to positive. Strength relative to Gold remains negative. Technical score: 0.0.
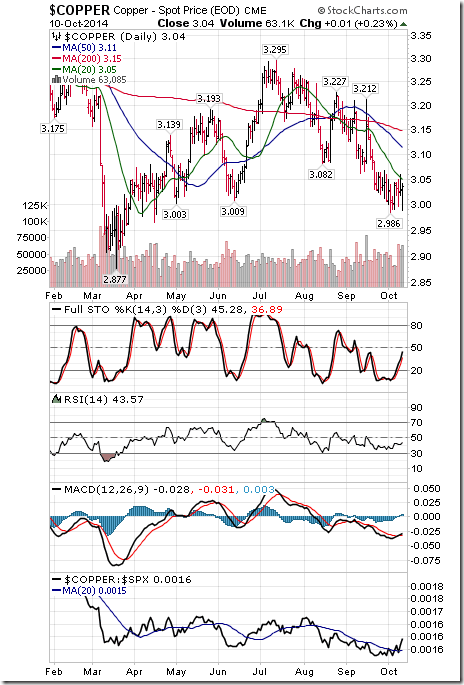
Copper added $0.04 per lb (1.33%) last week. Intermediate trend remains down. Copper remains below its 20 day moving average. Strength relative to the S&P 500 Index changed from negative to positive. Technical score improved to 1.0 from 0.0 out of 3.0. Short term momentum indicators are trending up.
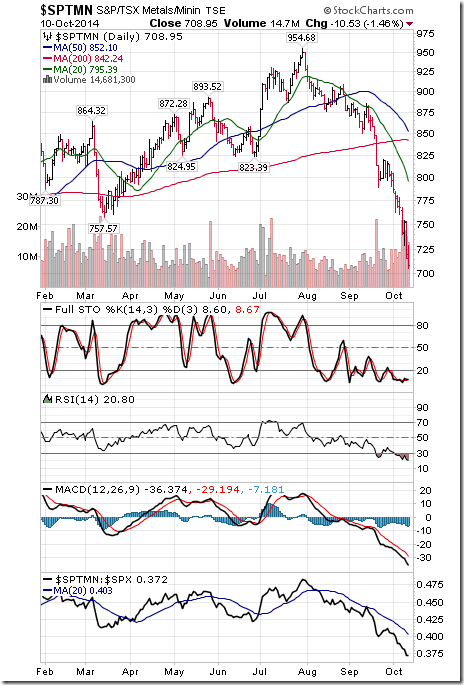
The TSX Metals & Mining Index plunged another 59.44 points (7.74%) last week. Intermediate trend remains down. The Index remains below its 20 day moving average. Strength relative to the S&P 500 Index remains negative. Technical score remains at 0.0 out of 3.0. Short term momentum indicators are trending down, but are oversold.
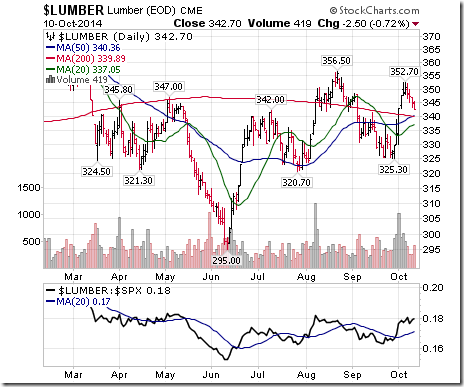
Lumber fell $6.50 (1.86%) last week. Intermediate trend remains neutral. Lumber remains above its 20 day moving average. Strength relative to the S&P 500 Index remains positive.
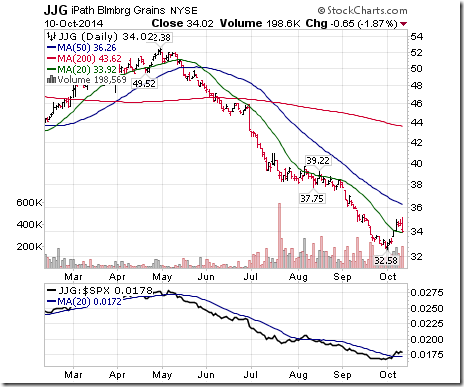
The Grain ETN added $0.81 (2.44%) last week. Intermediate trend remains down. Units moved above their 20 day moving average. Strength relative to the S&P 500 Index changed to positive from neutral. Technical score improved to 2.0 from 0.5 out of 3.0.
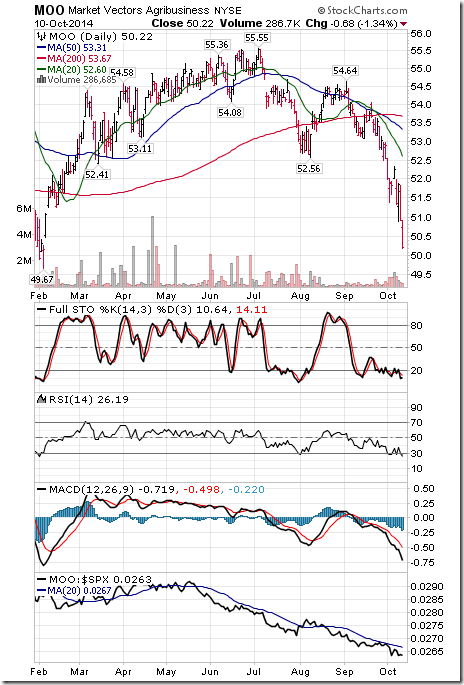
The Agriculture ETF fell $1.60 (3.09%) last week. Intermediate trend remains down. Units remain below their 20 day moving average. Strength relative to the S&P 500 Index remains negative. Technical score remains at 0.0 out of 3.0. Short term momentum indicators are trending down, but are oversold.
Interest Rates
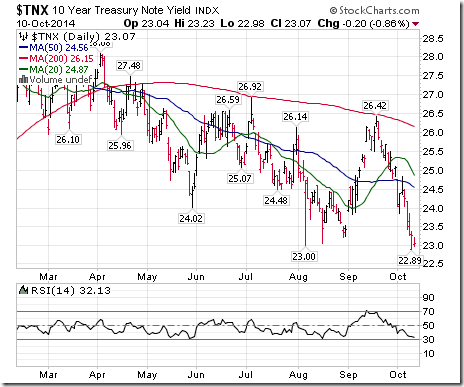
The yield on 10 year Treasuries dropped 14 basis points (5.72%) last week. Intermediate trend changed from up to down on a move below 2.30%. Yield remains below its 20 day moving average. Short term momentum indicators are trending down.
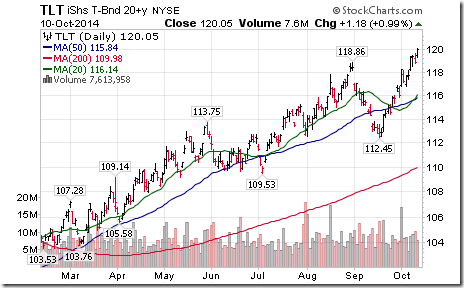
Conversely, price of the long term Treasury ETF added $2.35 (2.00%) last week. Intermediate uptrend was confirmed on a move above $118.86. Price remains above its 20 day moving average.
Other Issues
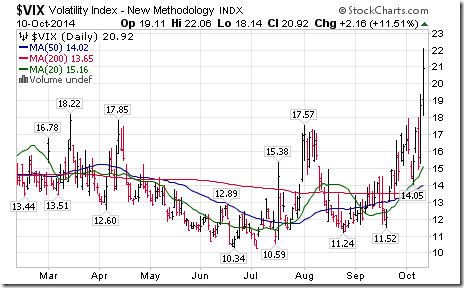
The VIX Index jumped 6.37 (43.78%) last week. Intermediate trend remains up. The Index remains above its 20 day moving average.
The S&P 500 Index broke below its 125 day moving average and its intermediate uptrend. Not a good sign!
Economic news this week is expected to show a slowdown in U.S. economic growth.
Third quarter reports start to pour in this week. 53 S&P 500 companies are scheduled to report. The focus is on the financial and technology sectors. Consensus for S&P 500 companies is for an 8% increase in earnings on a year-over-year basis. Impact of strength in the U.S. Dollar will become known shortly. Generally, strength in the U.S. Dollar will have a minor impact on third quarter revenues and earnings and a major impact on fourth quarter results. Watch out for companies that include negative fourth quarter guidance when they release third quarter results.
Short and intermediate technical parameters are deeply oversold for most world equity markets (exception: China), but have yet to show signs of bottoming.
International events remain a quiet concern (Europe possibly entering a recession, conflicts in Ukraine, Palestine, Iraq and Syria, the spread of Ebola).
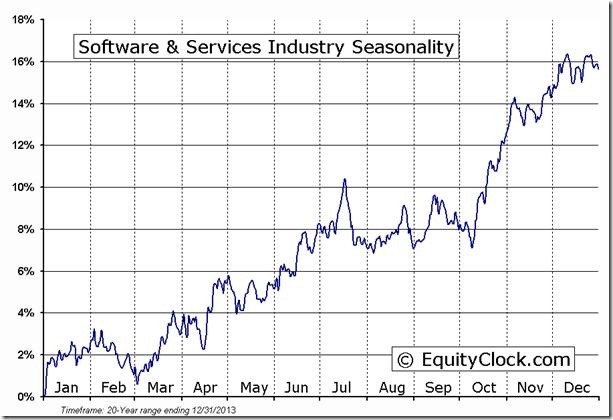
Seasonal influences are negative for most equity markets and sectors until the end of October (exception: Technology starting in mid-October). Typically at this time of year, equity markets are volatile, but are in the process of forming an intermediate bottom. Historically, the U.S. equity market has bottomed near the middle of October during a mid-term U.S. election year.
The Bottom Line
The expected bottoming process for most equity markets and sectors has yet to appear, but is likely to surface before the end of the month. It’s too early to make a major commitment, but planning for equity purchases when the bottoming process becomes apparent makes sense. Relative strength of economic sensitive equities and related ETFs (Industrials, Materials, Technology, Consumer Discretionary) will provide a clue. They normally are the first sectors to move higher each fall.
Special Free Services available through www.equityclock.com
Equityclock.com is offering free access to a data base showing seasonal studies on individual stocks and sectors. The data base holds seasonality studies on over 1000 big and moderate cap securities and indices. To login, simply go to http://www.equityclock.com/charts/
Following is an example:
S5SFTW Index Relative to the S&P 500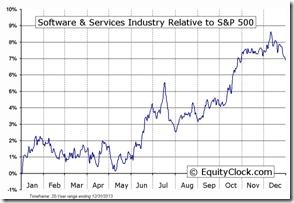 |
S5SFTW Index Relative to the Sector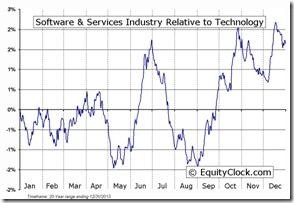 |
Monitored Technical/Seasonal Trade Ideas
A security must have a Technical Score of 1.5 – 3.0 to be on this list.
Green: Increased Technical Score
Red: Reduced Technical Score
StockTwits Released on Friday
Technical action by S&P stocks: Bearish at 10:45. $ICE, $VTR broke resistance. 23 stocks broke support.
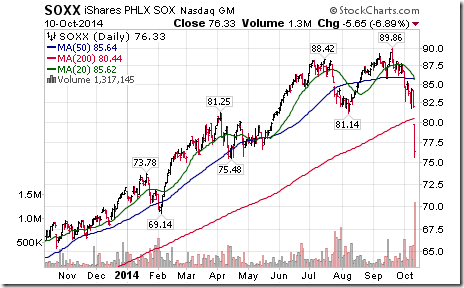
Weakness in semiconductors was triggered by guidance by MCHP. $SOXX was hit. Breakdowns: $MCHP, $MU, $NVDA, $TXN, $XLNX.
Technical Action by Individual Equities
By the close 31 S&P 500 stocks had broken support including General Electric, Intel, Cisco and MMM.
Three TSX 60 stocks broke support: Canadian Pacific, Canadian National Railway, Enbridge.
Disclaimer: Comments, charts and opinions offered in this report by www.timingthemarket.ca and www.equityclock.com are for information only. They should not be considered as advice to purchase or to sell mentioned securities. Data offered in this report is believed to be accurate, but is not guaranteed. Don and Jon Vialoux are Research Analysts with Horizons ETFs Management (Canada) Inc. All of the views expressed herein are the personal views of the authors and are not necessarily the views of Horizons ETFs Management (Canada) Inc., although any of the recommendations found herein may be reflected in positions or transactions in the various client portfolios managed by Horizons ETFs Management (Canada) Inc.
Individual equities mentioned in StockTwits are not held personally or in HAC.
Horizons Seasonal Rotation ETF HAC October 10th 2014
Copyright © Don Vialoux, EquityClock.com


![clip_image002[1] clip_image002[1]](https://advisoranalyst.com/wp-content/uploads/HLIC/0946d993a7d315b70db9842ad9949ecc.png)
![clip_image004[1] clip_image004[1]](https://advisoranalyst.com/wp-content/uploads/HLIC/9009f3a594c09fb0bc9b896e79e3bf38.png)
