With both the Canadian and the US Markets reaching new highs, for this weeks SIA Equity Leaders Weekly we are going to look at both the TSX Composite Index and also the S&P 500 Index. But, instead of using the traditional charts for this, we are going to look at a couple Canadian denominated ETFs that you could use to get exposure for your clients.
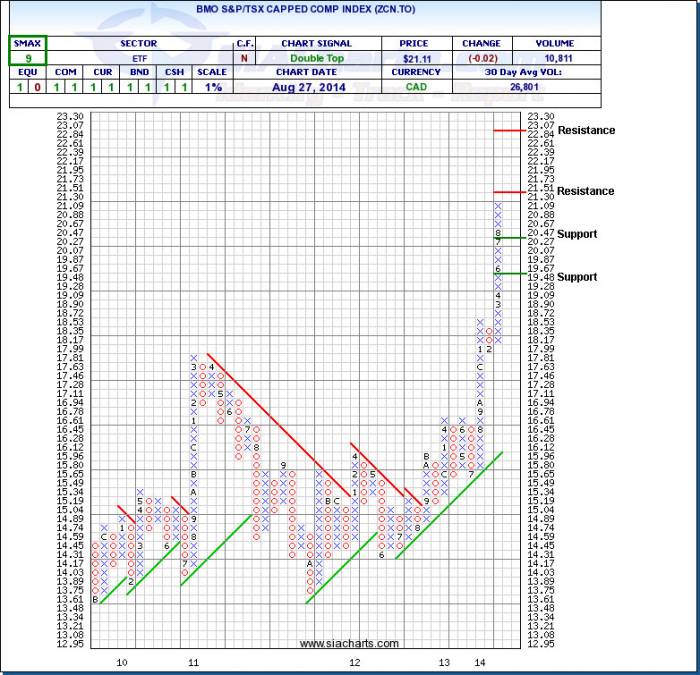
BMO S&P/TSX Capped Composite Index (ZCN.TO)
ZCN.TO is up at new highs, and is currently closing in on resistance at $21.51. Should the strength continue from there, then the next potential resistance is up at $23.07, giving ZCN.TO plenty of potential room to move.
With the SMAX at 9, ZCN.TO is showing short term strength across the asset classes.
Click on Image to Enlarge
BMO S&P 500 ETF CAD (ZSP.TO)
Next we are going to take a look at the US Markets, and as we can see from the chart that ZSP.TO is up at new highs for the year and still has some potential room to move before the next resistance level up at $25.67. There may also be some short term difficulty moving through the current level, as the S&P 500 itself is sitting right at the 2000 level. Support is now at $23.24, and again at $21.89.
These are just a couple of examples of ETFs that are denominated in Canadian currency that you can use, and there are several others that you can use as well to help you get access to not only the tracking of the index, but that also include dividends as well (as these do). Just be careful to make sure you research what the ETF does, as some may be Inverse, Hedged or Unhedged, or may not even be tracking the index you think they actually are.
One other note: we used 1% charts for both of these examples today.
Click on Image to Enlarge

SIACharts.com specifically represents that it does not give investment advice or advocate the purchase or sale of any security or investment. None of the information contained in this website or document constitutes an offer to sell or the solicitation of an offer to buy any security or other investment or an offer to provide investment services of any kind. Neither SIACharts.com (FundCharts Inc.) nor its third party content providers shall be liable for any errors, inaccuracies or delays in content, or for any actions taken in reliance thereon.
Copyright © SIACharts.com