by Adam Butler, http://gestaltu.com
Any analysis that relies on the past to offer guidance about the future makes the strong assumption that the future will in fact resemble the past. We have no guarantee that this will be the case. Many optimistic analysts assert that the invention of central banking, global communications and trade, robotics, 3D printing, Paul Krugman, or any number of ‘game changers’ that have evolved over the past few decades renders comparisons with our past misguided. Surely we won’t make the mistakes of our ancestors; there will be no more war, no misguided political decisions, no shortsighted thinking, no natural disasters, no panics or conflicts or excesses which derail our arc toward ever-increasing prosperity.
In case there is any ambiguity, we do not espouse this Polyanna-esque view. So long as markets, economies and politics are dominated by human judgement, the future is likely to resemble the past in most important respects.
Furthermore, there is, and perhaps always will be, a discussion of whether the stock market is in a ‘bubble’ or whether it is undervalued, overvalued or fairly valued. These labels are meaningless. In reality, markets are always at the ‘right price’ because the entire objective of free markets is to find the clearing price for assets, and the ‘right price’ is the price at which an asset transaction clears between a buyer and a seller. The right price might be higher, from a valuation standpoint, than the historical average implying lower than average future returns, or lower than the historical average implying higher than average future returns. The concepts of ‘right price’ and ‘overvalued’ are not mutually exclusive.
Moreover, we are acutely aware that interest rates are a discounting mechanism and thus low interest rates (especially rates which are expected to remain low for a long time) may justify higher than average equity valuations. This may be a normal condition of asset markets, but it doesn’t alter forecasts about future returns. While markets might be ‘fairly priced’ at high valuations relative to exceedingly low long-term interest rates, this does not change the fact that future returns are likely to be well below average. Again, a market can be ‘fairly priced’ relative to long-term rates, yet still exhibit high valuations implying lower than average future returns. We wouldn’t argue with the assertion that current conditions exhibit these very qualities. However, this fact does not change ANY of the conclusions from the analysis below.
—————————————————————————
We endorse the decisive evidence that markets and economies are complex, dynamic systems which are not reducible to linear cause-effect analysis over short or intermediate time frames. However, the future is likely to rhyme with the past. Thus, we believe there is substantial value in applying simple statistical models to discover average estimates of what the future may hold over meaningful investment horizons (10+ years), while acknowledging the wide range of possibilities that exist around these averages.
To be crystal clear, the commentary below makes no assertions whatsoever about whether markets will carry on higher from current levels. Expensive markets can get much more expensive in the intermediate term, and investors need look no further back than the late 2000s for just such an example. However, the historical implications of investing in expensive markets is that, at some point in the future, perhaps years from now, the market has a very high probability of trading back below current prices; perhaps far below. More importantly, investors must recognize that buying stocks at very expensive valuations will necessarily lead to future returns over the subsequent 10 – 20 years that are far below average.
Again, we are not making a forecast of market returns over the next several months; in fact, markets could go substantially higher from here. However, over the next 10 to 15 years, markets are very likely to revert to average valuations, which are much lower than current levels. This study will demonstrate that investors should expect 6.5% real returns to stocks only during those very rare occasions when the stock market passes through ‘fair value’ on its way to becoming very cheap, or very expensive. At all other periods, there is a better estimate of future returns than the long-term average, and this study endeavors to quantify that estimate.
Source: Philosophical Economics, 2014
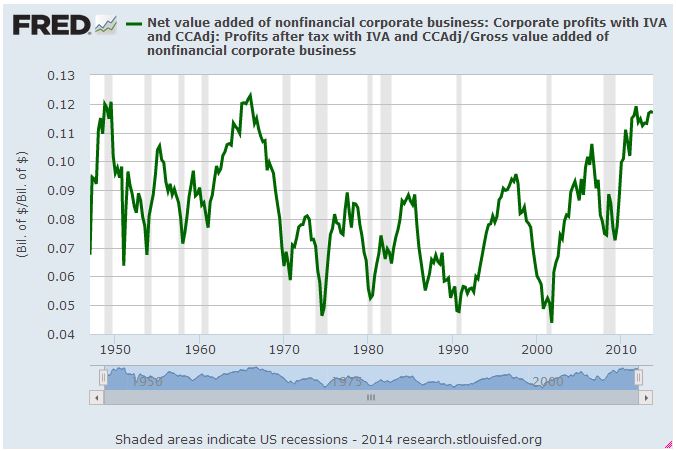
The profit margin picture is critically important. Jeremy Grantham recently stated, “Profit margins are probably the most mean-reverting series in finance, and if profit margins do not mean-revert, then something has gone badly wrong with capitalism. If high profits do not attract competition, there is something wrong with the system and it is not functioning properly.” On this basis, we can expect profit margins to begin to revert to more normalized ratios over coming months. If so, stocks may face a future where multiples to corporate earnings are contracting at the same time that the growth in earnings is also contracting. This double feedback mechanism may partially explain why our statistical model predicts such low real returns in coming years. Caveat Emptor.
Modeling Across Many Horizons

Process

Forecasting Expected Returns


Chart 2. 15-Year Forecast Returns vs. 15-Year Actual Future Returns

Putting the Forecasts to the Test

Conclusions
We first published a valuation based market forecast in September of 2010. At that time we used only the Shiller PE data to generate our forecast, and our analysis suggested investors should expect under 5% per year after inflation over the subsequent 10 year horizon. Over the 40 months since we have introduced several new metrics and applied much more comprehensive methods to derive our forecast estimates. Still, our estimates are far from perfect.
From a statistical standpoint, the use of overlapping periods substantially weakens the statistical significance of our estimates. This is unavoidable, as our sample only extends back to 1900, which gives us only 114 years to work with, and our research suggests that secular mean reversion exerts its strongest influence on a periodicity somewhere between 15 and 20 years. As a result, our true sample size is somewhere between 5 and 6, which is not very high.
Aside from statistical challenges, readers should consider the potential for issues related to changes in the way accounting identities have been calculated through time, changes to the geographic composition of earnings, and myriad other factors. For a comprehensive analysis of these challenges we encourage readers to visit the Philosophical Economics (PE) blog.
It should be noted that, while we recommend readers take the time to consider the comprehensive analyses published by Philosophical Economics over the past few months, we are rather skeptical of some of the author’s more recent assertions. In particular, we challenge the notion that model errors related to dividends, growth and valuations are independent of one another, and can therefore be disaggregated in the way the author presents. Dividend yields and earnings growth are inextricably and causally related to each other (lower dividend payout ratios are causally related to stronger future earnings growth because of higher rates of reinvestment, and vice versa), thus we would expect them to have inverse cumulative error terms. The presence of such inverse error terms simply proves this causal link empirically, and offers no meaningful information about the validity of valuation based reversion models.
We also take grave issue with the contention that the valuation-based reversion observed in stocks over periods of 10 years (which Hussman uses) should be dismissed as ‘curve fitting’. According to PE, since we observe some reversion over 10 year periods we should observe the same or stronger reversion over a 30 year horizon, because 30 years is a multiple of 10 years. But the author discovers virtually no explanatory relationship at 30 year reversion horizons. From this observation he concludes that valuation-based mean-reversion at the 10 year horizon is invalid, and that the 10 year reversion relationship is a curve-fit aberration with no statistical significance.
The logical flaw in this argument is revealed by an examination of our own results. Our analysis suggests markets exhibit most significant mean reversion at periods of 15 to 20 years (though 10 years is still significant). This suggests that markets will have completed a full cycle (that is, will have come ‘full circle’) after 30 or 40 years. In other words, if markets are currently expensive, then 15 or 20 years from now they will probably be cheap. Of course, 15 or 20 years on from that point (or 30 to 40 years from now) markets will have returned to their original expensive condition. Thus no mean-reversion relationship will be observed over 30-40 years. Any analyses of mean reversion over periods of 30 or 40 years will not find any relationship because cheap prices will have passed through expensive prices and gone back to cheap over the span of the full cycle.
In case this is still unclear, consider a similar concept in a related domain: stock momentum. Eugene Fama, the father of ‘efficient markets’ described the momentum anomaly in equities as ‘the premier unexplained anomaly’, yet it only works at a frequency of about 2 to 12 months; that is, if you buy a basket of stocks that had the greatest price increase over the prior 2 to 12 month period, those stocks are likely to be among the top performers over the next few weeks or months. However, momentum measured over a 3 to 5 year period works in precisely the opposite manner: the worst performing stocks over the past 3 to 5 years generate the strongest returns. Now, 3 and 5 years are multiples of 12 months, yet extending the analysis to multiples of the 12 month frequency delivers the exact opposite effect. Should we dismiss the momentum anomaly as curve fitting then?
Eugene Fama doesn’t think so, and neither do we.
That said, we see value in the questions PE raised about the changing nature of earnings series and margin calculations. Largely driven PE’s analysis, we integrated new earnings series from Bloomberg and S&P into our Cyclically Adjusted PE calculation for model calculations. Primarily, the new series adjust earnings for changes to GAAP rules in 2001 related to corporate write-downs. Each of the series has merit, so we took the step of averaging them without prejudice. I’m sure bulls and bears alike will find this method unsatisfying; we certainly hope so, as the best compromises have this precise character.
Importantly, the new earnings series do not alter the final regression forecast model results because our multiple regression model rejects the Shiller PE as statistically insignificant to the forecast. That is, it is highly collinear with, but less significant than, other series like market cap/GNP and q ratio. This has been the case from the beginning of this article series, so it isn’t due to the new earnings data. Nevertheless we include regression parameters and r-squared estimates for all of the modified Shiller PEs in the matrices as usual.
The bottom line is that, despite statistical and accounting challenges, our indicators have proved to be of fairly consistent value in identifying periods of over and under-valuation in U.S. markets over about a century of observation, notwithstanding the last two decades. We admit that the two decades since 1994 seem like strange outliers relative to the other seven decades; history will eventually prove whether this anomaly relates to a structural change in the calculation of the underlying valuation metrics, a regime shift in the range of possible long-term returns, an increase in the ambient slope of drift, or something as of yet entirely unconsidered.
We all must acknowledge that the current globally coordinated monetary experiment truly has no precedent in modern history. For this reason the range of potential outcomes is much wider than it might otherwise be. Things could persist for much longer, and reach never before seen extremes (in both directions, mind you!) before it’s over.
Lastly, I am struggling to reconcile a conundrum I identified very early in the development of our multi-factor model. Namely, the fact that the simple regression of real total returns with reinvested dividends carries very different implications than the suite of other indicators we have tested. Georg Vrba explores this model in some detail, and we recommend readers take a moment to consider his views in this domain. I am troubled by the theoretical veracity of incorporating dividend reinvestment for extrapolation purposes, because the vast majority of dividends are NOT reinvested, but rather are paid out, and represent a material source of total income in the economy. However, the trend fit is surprisingly tight, and I can’t say with conviction that the model is any less valid than the other methods we apply in this analysis. It is a puzzle.
The bottom line is that as researchers, we deeply appreciate respectful disagreements. This is because there are only three possible outcomes for the introduction of new and contrary evidence into a discussion. First, it could prove worthy of inclusion, improving the accuracy and timeliness of estimates. The inclusion of new earnings series is an excellent example of this, as we’ve been convinced by the evidence presented by Jesse Livermore in this domain. Second, it could prove unworthy of inclusion, which we can only know upon stress-testing our model, thereby increasing our confidence in its reliability. The rejection of the notion that valuation-based reversion is curve-fitting would be such an example. Or third, it could provoke a ‘deep dive’ that evolves into a complete overhaul of current models, and/or an interesting future research publication. Vrba’s dividend reinvestment notion is a prominent member of this category.
We thank everyone – on all sides of the debate – for their continued contributions (either explicitly or implicitly) to the ongoing evolution of this research.
The post Valuation Based Equity Market Forecasts: Q2 2014 appeared first on GestaltU.
Source link