

The Compounding Effect of Not Selling
What many advisors fail to realize when they are handling client money is that not only is there a compounding effect of money (Rule of 72 etc.) but there is also a compounding effect by not selling positions in a timely fashion, or at all. For this week's SIA Equity Leaders Weekly, we are going to look at a couple of positions in the SIA S&P/TSX 60 Report and see how much damage has been done by not selling.
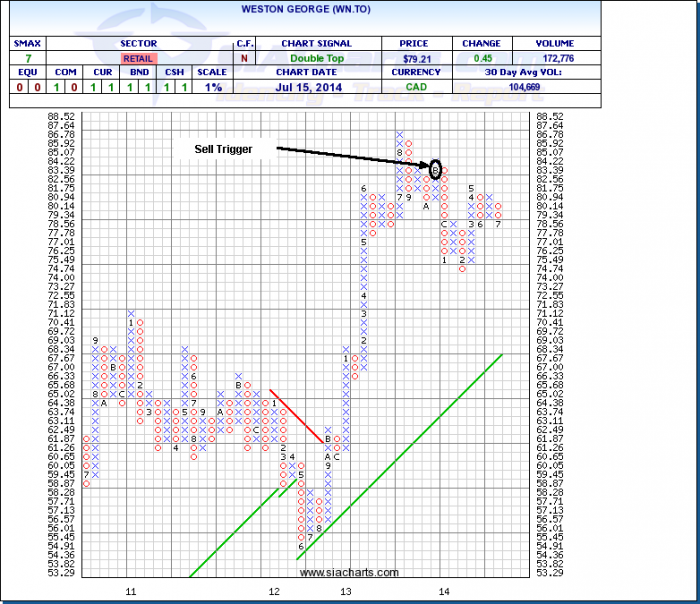
Weston George (WN.TO)
Looking at the first chart, we can see that the sell trigger on WN.TO occurred around $85 towards the end of October 2013. Since that point, the stock has moved down over 6%, while the XIU.TO benchmark is up over 14%. Not only did the stock lose an additional amount after when it should have been sold, but it also missed out on the positive effect those dollars could have experienced, thereby compounding the loss.
Click on Image to Enlarge
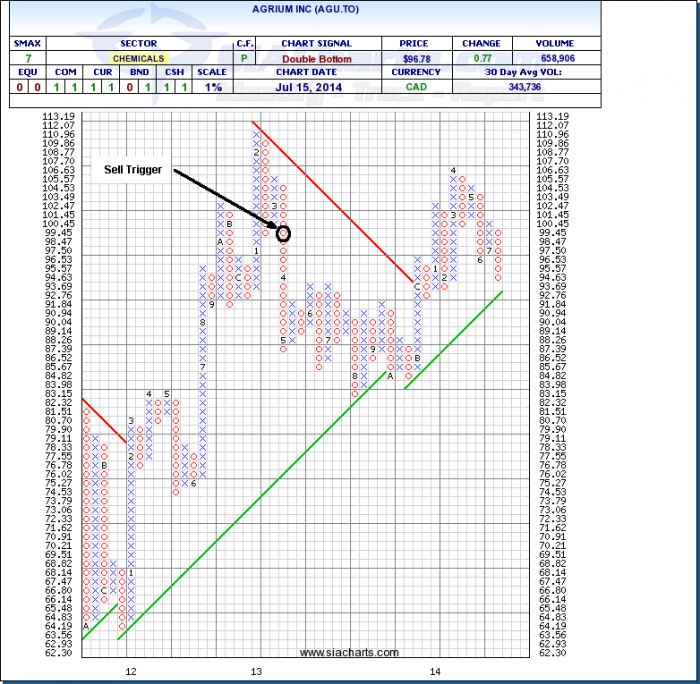
Agrium Inc (AGU.TO)
Next, looking at Agrium, this stock fell out of the Favored zone and hit the stop triggers at the end of March 2013, right around $100. Well over a year later, and AGU.TO is down nearly 3%, while the benchmark is up almost 20%.
How often do you look at what the opportunity cost is of continuing to own a stock that you likely know you should be getting out of? Next time, don't just consider what the potential loss could be on a go forward basis, but also give serious thought to how much additional 'relative' money could be lost by not investing those funds elsewhere. There is always an opportunity cost of holding onto potentially losing positions when that money could be better served in potentially winning positions.
** - On a side note, one model by one of our subscribers sold AGU.TO and bought MG.TO with the proceeds. MG.TO is now up 100% since that trade!
Click on Image to Enlarge
SIACharts.com specifically represents that it does not give investment advice or advocate the purchase or sale of any security or investment. None of the information contained in this website or document constitutes an offer to sell or the solicitation of an offer to buy any security or other investment or an offer to provide investment services of any kind. Neither SIACharts.com (FundCharts Inc.) nor its third party content providers shall be liable for any errors, inaccuracies or delays in content, or for any actions taken in reliance thereon.
Copyright © SIACharts.com