“Making a Market Call”
Jeffrey Saut, Chief Investment Strategist, Raymond James
July 7, 2014
By the time the 2nd quarter was complete 2014 was in the process of being transformed from a flat year for risk assets and a strong year for fixed income into a much more encouraging year for the former and perhaps less so for bonds. Indeed if the SPX index were to simply replicate its first +6.05% half performance the full year return would be very close to that of 2010 (12.78%) and 2012 (13.41%), both of which went into the history books as ‘good years.’ Of course first halves are not always predictive of second halves. 2011’s gain of 5.01% in its first two quarters was entirely wiped out by what followed, with most participants grateful that after collapsing in the summer and early fall the SPX index clawed its way back to close the year exactly where it started at 1257.6. With regards to the rest of 2014 our sense remains that the bull market is very much intact, but that round number resistance at 2000 in the SPX (just over 1% above the current price) and 4000 in the NDX (2.6% above Wednesday’s close) may prove to be tough levels to surpass in the immediate future.
... Marketfield Asset Management (7/3/14)
In last Monday’s strategy report I noted that the week before July 4th has an upward bias for the equity markets. On Tuesday I backed that up by writing, “From 1950 to 2013 the market has delivered positive returns 72% of the time during the last two days of June and the first five days of July.” Thackray’s Seasonal Investment Guide goes on to write, “By mid-July, seasonal investors should probably be looking for the exits and moving to a more defensive position as the market enters into a period of seasonal weakness.” Obviously that statement “foots” with what the folks at Marketfield Asset Management believe given their statement, “But that round number resistance at 2000 in the SPX and 4000 in the NDX may prove to be tough levels to surpass in the immediate future.” To be sure, that agrees with what I think, even though the S&P 500 (SPX/1985.44) has surpassed my envisioned resistance zone of 1950 – 1975. The move above that level I would describe as “forereach.” For those non-nautical types, the hull of a sailboat, unlike a powerboat, is so “slick” in the water that even after you drop the sails, or cut the engine, the boat continues to move forward ... aka, “forereach.”
I was keenly interested in Marketfield’s comments on the year 2011 because I have made the comparison to the summer of 2011 in recent missives. Recall, the SPX peaked the second week of July at ~1356 and began to slide. That slide accelerated in late July into early August, culminating with the psychological low of August 9th at 1100. From there the SPX was range-bound between roughly 1120 and 1220 until its undercut low (below the psychological low of 1100) of October 4, 2011 at 1075. At that point the bottoming process was complete with the SPX never experiencing anything more than a 10% decline. In fact, since the 10% pullback of April through June 2012, there has not been even a 10% drawdown.
Like Marketfield, I have revisited the summer of 2011 because I have been getting similar readings for a pickup in volatility arriving in mid-July 2014, very much like what we saw in June of 2011. Moreover, the stock market’s internal energy readings are likewise at levels last seen during the summer of 2011. Now history doesn’t necessarily repeat itself, but it does indeed sometimes rhyme. Accordingly, I am making a “call” for the potential of the first decent pullback of the year to begin in mid-July or early August; and am recommending culling non-performing stocks from portfolios to raise cash. If said decline fails to materialize, we can always recommit the cash to more favorable situations because longer-term I believe this secular bull market has years left to run.
Speaking of making a “call,” last week some of our fundamental analysts made some “line in the sand” type of calls. Those “calls” stemmed from the revelation that the PC computer business fell off a cliff in June. As our IT distribution analyst explained, as paraphrased by me:
Synnex (SNX/$70.37/Market Perform) announced May results, and the quarter was strong, but the key point was that if you look at the forward guidance for August it was way below seasonal guidance distribution at down 5% sequentially. This reflects a drop-off, and a step-down, in the PC refresh cycle. It confirms our end of quarter channel checks that show PC sales started to really slow in May and into June. This is not just important for my distribution group, but other groups because most investors think the PC refresh cycle will continue throughout the 3Q14 and into the 4Q14. There are a lot of PC-related stocks that have done very well year-to-date (YTD) and could be vulnerable as these weak data points start to make their way into the market. PC sales really dropped off in the month of June.
Building on those comments, one of our semiconductor analysts talked about Intel (INTC/$31.14/Underperform), again as paraphrased by me:
Intel is uniquely vulnerable here. I don’t want to make this a general thing. This is not a call to sell the entire basket of semi stocks. It is an Intel problem from a hardware perspective. It’s just a question of how quickly they lose market share. We think this is an opportunity to tell our clients to get out of Intel.
Wow, I thought, while he didn’t use the dreaded four letter word you almost never hear from Wall Street – SELL – the statement, “We think this is an opportunity to tell our clients to get out of Intel” is certainly a strong “call” from any analyst!
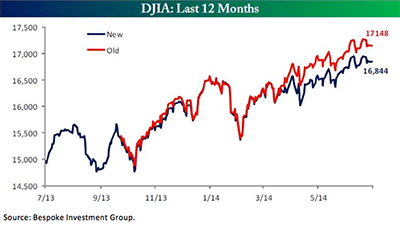
It is also worth mentioning that Intel is a D-J Industrial Average (INDU/17068.26) component, as well it is VERY overbought on a near/intermediate-term basis. In fact, except for Boeing (BA/$128.51), Du Pont (DD/$65.80), and McDonald’s (MCD/$100.98/Market Perform), all of the Dow components are overbought. Interestingly, the Dow has underperformed most of the other indices YTD. One of the reasons for this underperformance is the Dow is price-weighted. The higher the price of a stock, the more weighting it is given in the index. Another reason for this underperformance is poor stock selection. As the always eagle-eyed folks at Bespoke observe:
Last September, a major shakeup to the index took place in which three stocks were removed (Alcoa, Bank of America, and Hewlett Packard) and three were added (Goldman Sachs, Nike, and Visa). ... All three stocks added to the index last September are down so far in 2014 for an average decline of 4.4%. In terms of their collective impact on the DJIA, they have accounted for 147 points of downside in 2014. Meanwhile, the three stocks that were removed from the index last September are up an average of 19.75% (see chart on next page)!
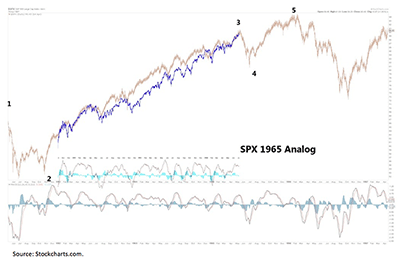
The call for this week: Just like our fundamental analysts are making a negative “call” on the PC computer business that fell off a cliff in May/June, I am making a “call” that the current set-up in the equity market is remarkably similar to the summer of 2011 that ushered in an 18% decline. While I do not think any pullback from here will be that severe, I do think we are vulnerable to a 10% - 12% decline in the weeks ahead, albeit within the construct of a secular bull market that has years left to run. Still, I was intrigued by a chart sent to me by a prescient stock market observer. Most of you know that I decry such historical comparisons, like I did with the 1929 comparison chart of a few months ago. This one, comparing 1965 to the present, however, may have merits as I studied the news backdrop of 1965 and 1966 versus now (see chart on next page). Last week the SPX tried to surmount 2000 and failed. If you study the last two cyclical bull moves, both of them ended in either one of two ways. They either failed to better a number like 2000, or they made a peak-a-boo look above a similar number. In either event, this feels more like a crescendo to me rather than the start of a new leg to the upside.
Copyright © Raymond James


