This week for the Equity Leaders Weekly, we going to highlight a long-term interest rate and a Gold ETF. It's been a while since we last looked at the charts for both the 30-Year interest rate and for Gold, so for this week we are going to look in on both of these to see what has changed in their trends.
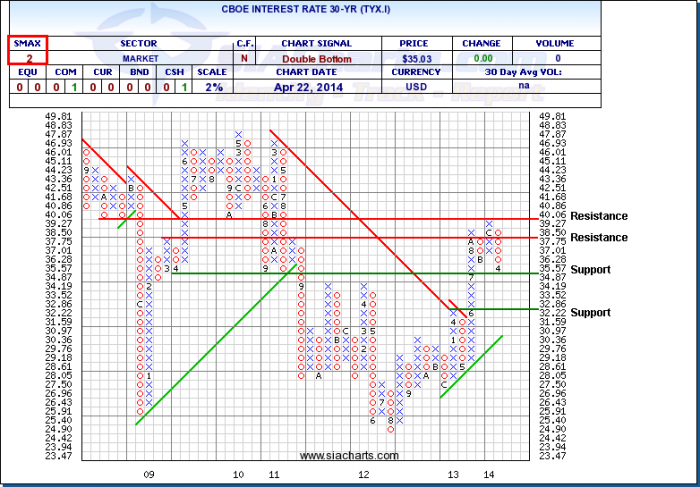
CBOE Interest Rate 30-YR (TYX.I)
Not much has happened in the last 3 months since we last looked at TYX.I. Over that time it has now dropped down 1 box to the support level at 3.487%. For the last 10 months the 30-Yr Interest Rate has been stuck between roughly 3.5 and 4 percent.
With an SMAX score of 2 out of 10, the TYX.I is showing near-term weakness versus the other asset classes as it has moved down to first support level. Watching whether this support level for the channel holds will be important as continued weakness could signal a move from Equities into Bonds, driving down yields.
Click on Image to Enlarge
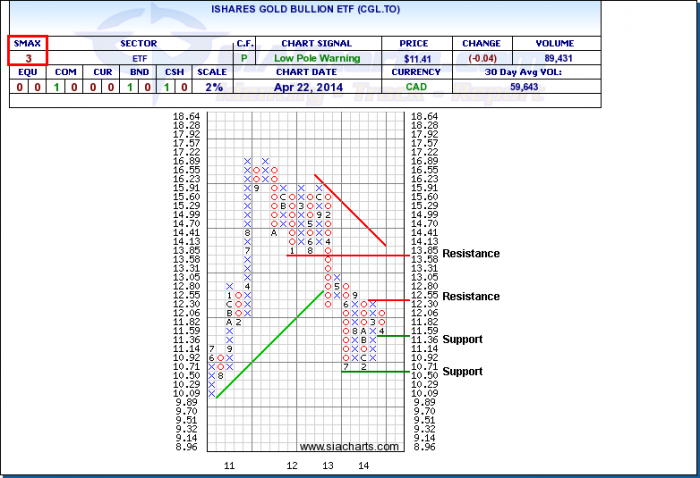
iShares Gold Bullion ETF (CGL.TO)
Usually we look at the continuous contract, but instead for this week we are looking at one of the Canadian ETFs that tracks Gold. As we can see from the chart, CGL.TO has recently seen a pullback after its run up back in February and March, moving down to its first support level at $11.36. Should the weakness continue then the next support is down at $10.50, which is the bottom of the channel that gold has been stuck in for almost the last year. The resistance is up at the top of the channel at $12.55, with secondary resistance up at $13.85.
Overall we are seeing short-term weakness against the asset classes with the SMAX at 3, and longer term weakness against the ALL CAD ETF group, as CGL.TO currently sits well down in the Unfavored zone. If looking for another Commodity idea instead of Gold, you can refer to the SIA "CAD Commodities" Report in the ETF section for other ideas.
Click on Image to Enlarge
SIACharts.com specifically represents that it does not give investment advice or advocate the purchase or sale of any security or investment. None of the information contained in this website or document constitutes an offer to sell or the solicitation of an offer to buy any security or other investment or an offer to provide investment services of any kind. Neither SIACharts.com (FundCharts Inc.) nor its third party content providers shall be liable for any errors, inaccuracies or delays in content, or for any actions taken in reliance thereon.
Copyright © SIACharts.com