by Eddy Elfenbein, Crossing Wall Street
Here’s a look at the yield spread between the 5- and 30-year Treasuries. The gap between the two recently narrowed to 177 basis points which is a 4.5-year low.
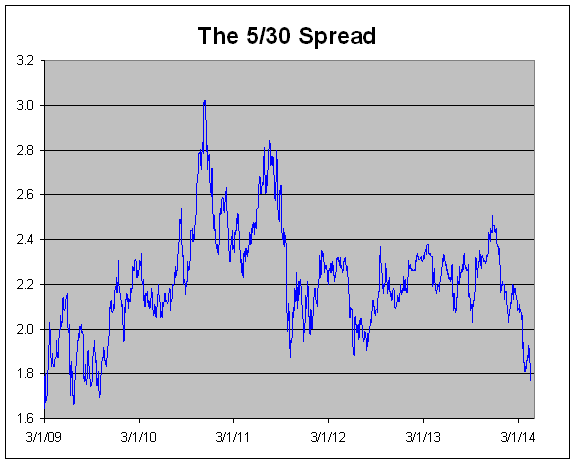
What’s happening is that the back end of the yield curve is starting to flatten. Bear in mind that it’s still quite steep. It’s merely not as steep as it used to be.
What does this flatter back end mean? It’s hard to say but I suspect there are two opposing forces at work. At one end, investors are realizing that the U.S. fiscal situation isn’t as dire as once believed. The CBO recently had the “good” news that this year’s deficit will be under half a trillion dollars (yay?). That’s huge but not as huge as it used to be. Also, yields in the middle part of the yield curve are starting to reflect the belief that interest rates will rise next year, and in 2016.
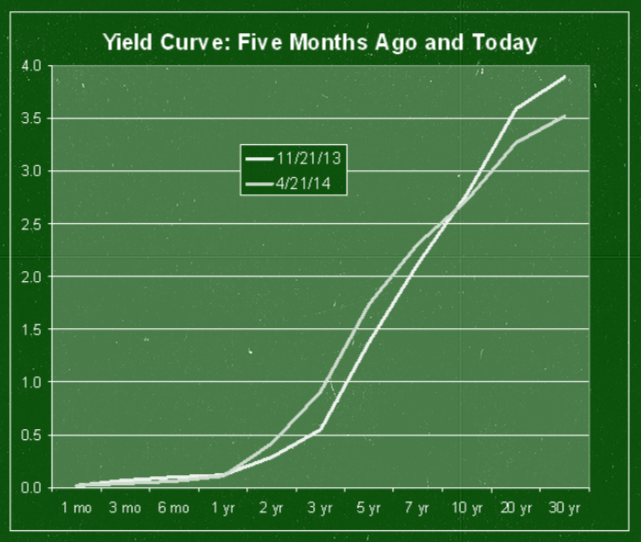
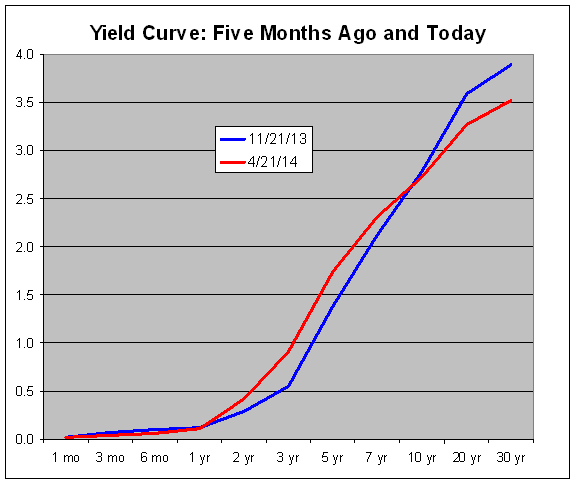
Here’s a look at the yield curve from five months ago and from yesterday. You can see where the red line is both higher and lower than the blue.
Historically, the best indicator for the economy has been the spread between the 2- and 10-year Treasuries. That’s still quite wide.
Copyright © Eddy Elfenbein