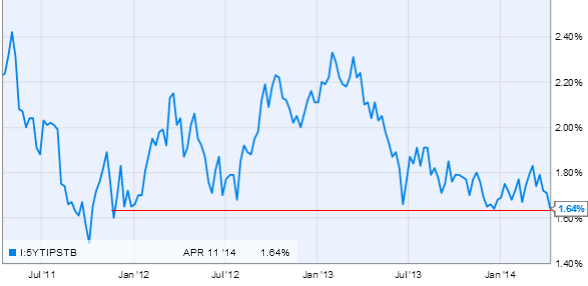


For this week's edition of the Equity Leaders Weekly, we are going to review the Nasdaq Composite Index on both a shorter term and a longer term perspective given its recent volatility. Last week, there were several commentaries in the news stating "the collapse in the Nasdaq continues" and that investors are very fearful about the markets again after its third weekly drop. Let's take a closer look and review what has happened.
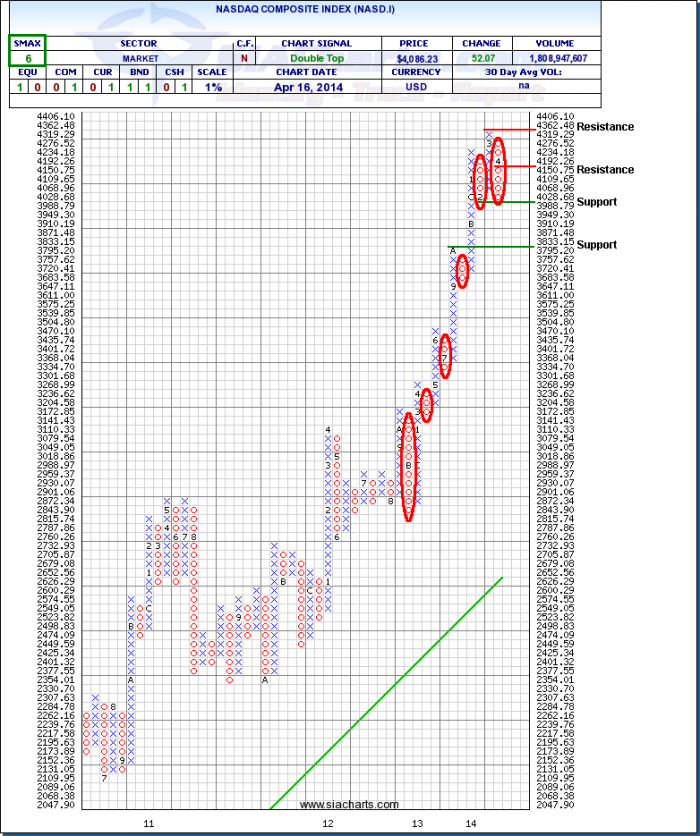
Nasdaq Composite Index (NASD.I) (1% chart)
Looking at the Nasdaq Composite Index on the 1% chart we see it hit resistance at 4362.48 and has corrected about 7% since reaching this multi-year high. However, rather than this being a "collapse" in the Nasdaq, this would still be considered a correction within this current uptrend until the market tells us otherwise. What has scared many investors is that before 2014 the Nasdaq didn't experience a correction of more than 5% since late 2012, and yet in 2014 it has now experienced 2 corrections of 5% or more. Drilling down even further, as of Apr.14, 2014 there were 17 stocks within the Nasdaq Composite that were down more than -10% over 1 month. And 11 of these 17 stocks were in the Internet and Drugs sector. Clearly, Internet and Drugs stocks were experiencing the most pain. Furthermore, the average return for these combined 17 stocks in 2013 was a staggering +113%. So the stocks that had some of the best returns in 2013 were now experiencing some of the biggest drawdowns so far in 2014. It remains to be seen if this results in a much larger correction for the broader markets but for now it looks like some of the froth is being taken off some of the high flying stocks of last year.
Click on Image to Enlarge
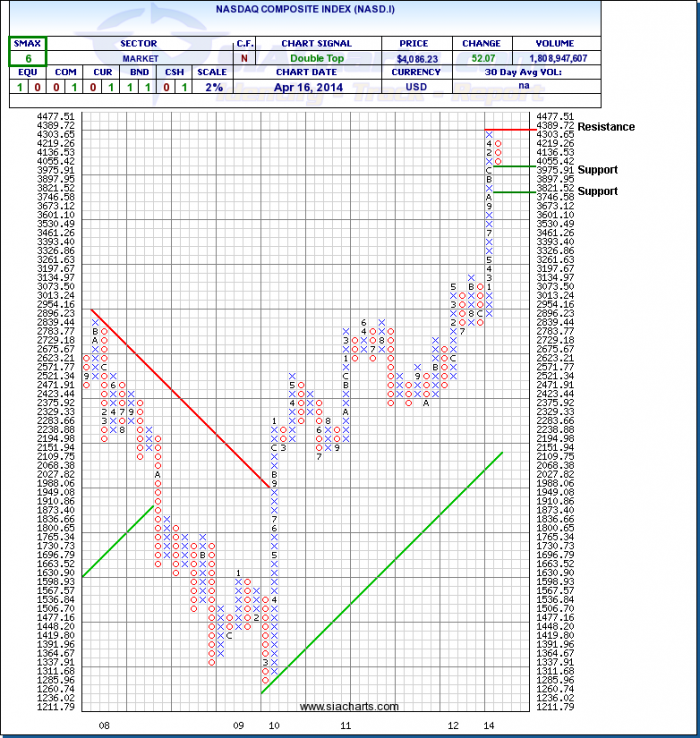
Nasdaq Composite Index (NASD.I) (2% chart)
Now let's examine the Nasdaq Composite Index on a longer term perspective using a 2% chart. Before this week, the Nasdaq had not experienced a 3 box reversal on a 2% chart since Nov.2012. So not surprising it was due for a correction. Comparing this current correction to its previous corrections we see that the last significant correction on the Nasdaq was in June & Nov 2012 where the index experienced two 10% corrections in that year. Prior to that in 2011, the Nasdaq went through an 18% correction in August followed by a 10% correction in November. And in 2010, the Nasdaq had an 18% correction that occurred over 2 volatile months. So to put this current 7% correction (as of Apr.14) in perspective the Nasdaq has experienced multiple correction periods from its bear market low in 2008-2009. And the only year since its low in 2008-2009 that the Nasdaq didn't experience a correction of 10% or more was in 2013. So 4 out of the last 5 years saw at least one 10% correction. So if the current market volatility has you scared, just remember the market has been here before and at the time of this writing is undergoing a much needed breather. Support is currently sitting at 3975.91 and should this weakness continue, its next support level is at 3746.58. To the upside, resistance is now at 4389.72 on a 2% chart. This will be an important level for the Nasdaq to break through if it is going to continue its current uptrend. As always, we continue to monitor the supply/demand characteristics of the markets and adapt our stance when necessary.
Click on Image to Enlarge
SIACharts.com specifically represents that it does not give investment advice or advocate the purchase or sale of any security or investment. None of the information contained in this website or document constitutes an offer to sell or the solicitation of an offer to buy any security or other investment or an offer to provide investment services of any kind. Neither SIACharts.com (FundCharts Inc.) nor its third party content providers shall be liable for any errors, inaccuracies or delays in content, or for any actions taken in reliance thereon.
Copyright © SIACharts.com