“It seems like the higher mathematics with more false precision should help you but it doesn’t. They teach that in business schools because, well, they’ve got to do something.” – Charlie Munger
I received a number of comments on my Do You Need Commodities in Your Portfolio? post from fans of investing in commodities. Many asked why commodities wouldn’t be the perfect investment for diversification benefits based on Modern Portfolio Theory because of the fact that they have a low correlation to stocks.
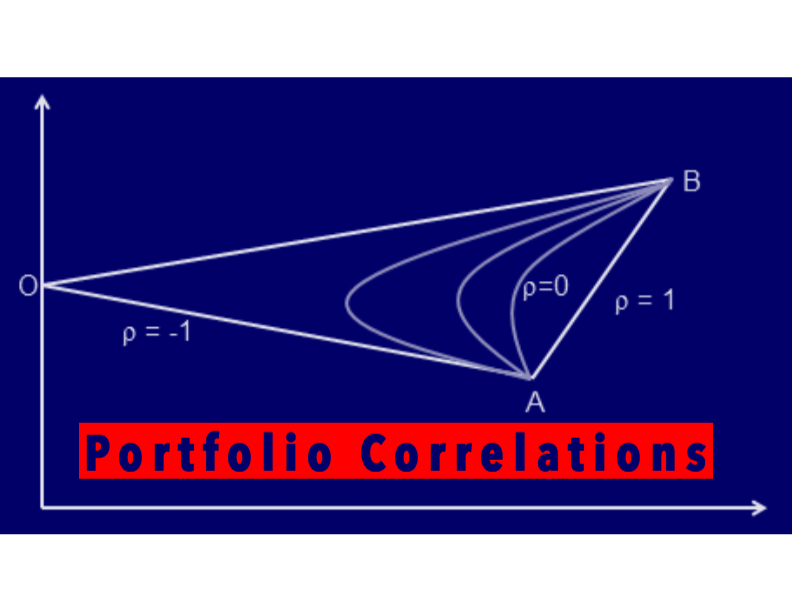
This seems like a good time for a quick primer on correlation. Correlation measures how strongly two data sets are related with one another from a scale of -1 to +1. A negative correlation occurs when one value increases and another decreases while a positive correlation exists when both values increase together. Correlations near 0 means there is no relationship one way or another.
Diversified investors typically look for non-correlated assets so they don’t move in lock-step with one another. In theory, this can reduce your risk.
But many investors mistake correlation for the be-all-end-all in portfolio risk control. Using a single variable such as correlation can lead to problems in portfolio construction if you don’t use some discretion.
Here are four issues to consider when using correlation as a historical data point along with some examples:
1. Low Correlation Is Not Always a Good Thing
Here are the correlations with the S&P 500 of various asset classes going back to 1991*:

These numbers show why low correlation to the broader stock market isn’t the only pre-requisite for inclusion in a portfolio. Cash has little correlation with the S&P 500, just as commodities do, but that doesn’t mean it makes sense to hold cash over the long run.
Cash (T-Bills) earned investors only 3% per year in this time frame while commodities gave you around 4% a year (with much higher volatility). Bonds, on the other hand, returned nearly 6.5% annually and proved their worth as a diversifier to equities.
So low correlation can help, but not always.
2. Correlations Change Over Time
Compare the longer-term correlations above with this 13 year period…

…and this 11 year stretch:

Commodities showed an ability to zig while stock zagged from 1991 to 2003, but have had a much closer relationship since that time. Emerging market stocks have also shown a stronger positive relationship to the S&P while bonds and cash flipped to negative correlations.
Investment environments are never quite the same across time. Interest rates, economic growth, industry leadership, inflation, innovation and a host of other factors are continuously changing as time marches on. It’s impossible to extract perfect relationships in the movement of the markets strictly using past correlation data.
3. A Strong Correlation Does Not Mean Similar Performance
The correlation between commodities and emerging markets during 2004-2013 was +0.90, a very strong positive relationship. Yet in that time EM stocks were up nearly 200% while commodities rose just 9% in total.
So while these two investments moved together fairly regularly, the total returns weren’t anywhere close to one another in magnitude.
Meanwhile, in the same period, EM stocks and U.S. bonds had basically no correlation with one another (only 0.07) but bonds still made investors nearly 60% in total.
4. Modern Portfolio Theory (MPT) Does Not Rest On Correlations Alone
Although correlations, co-variances and these types of statistics are important aspects of MPT, it’s not enough to simply add non-correlated asset classes together to find the best portfolio.
The whole point of MPT is to create a portfolio that gives you the highest return for a given level of risk. Adding highly volatile investments, such as commodities, simply because they have shown low correlation in the past does not lead to higher risk-adjusted returns. In this construct, higher volatility should lead to higher expected returns (in the long-term) which is something commodities have not done.
Of course, MPT is not a perfect solution to portfolio construction. The most efficient portfolio created by MPT will always be based on historical data that is in a constant state of change, as you can see from the data presented here.
The perfect portfolio is still the one that you can stick with based on your personal circumstances, risk tolerance and time horizon, not the one you create using fancy mathematical formulas.
In Your Money & Your Brain, Jason Zweig told a great story about Harry Markowitz, the Nobel Prize winning creator of Modern Portfolio Theory. Markowitz shared this honest admission with Zweig:
“I should have computed the historical co-variances of the asset classes and drawn an efficient frontier.” (That’s efficient-market talk for draining as much risk as possible out of his portfolio.)
But, he said, “I visualized my grief if the stock market went way up and I wasn’t in it — or if it went way down and I was completely in it. So I split my contributions 50/50 between stocks and bonds.”
Although number crunching can be an important part of your investment strategy, the ability to have some self-awareness in the biases of the data you use is much more important.
As always, the qualitative factors will trump the quantitative factors in your portfolio.
Source:
Your Money & Your Brain
Copyright © A Wealth of Common Sense