


Over the past couple of months there has been a lot of volatility in the Equity Markets, and as a result of that there are a lot of "experts" who have been weighing in with their professional opinion as to what direction the markets may be headed in. For this weeks edition of the SIA Equity Leaders Weekly we are going to take a close look at the Equity Vs. Bonds relationship in both the US and Canada, using some ETFs for our comparisons.
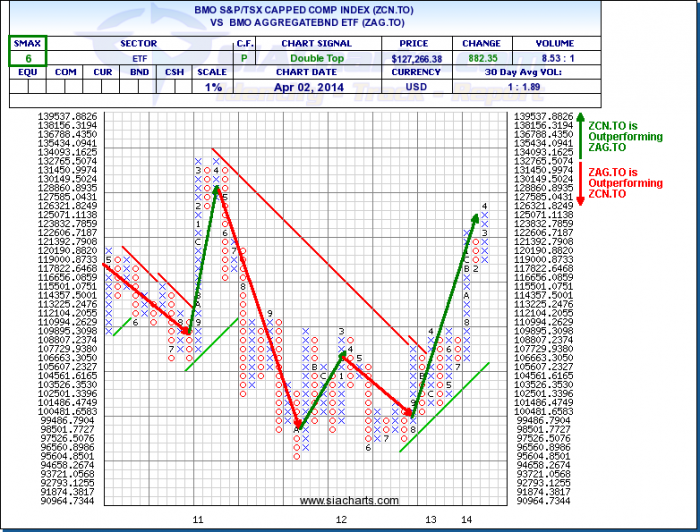
BMO S&P/TSX Capped Comp vs. BMO Aggregate Bond (ZCN.TO^ZAG.TO)
Looking at the chart we can see that over the past few years there have been some ebbs and flows between ZCN.TO (Equity) and ZAG.TO (Bond), but for the last year it has really been all about ZCN.TO except for some minor pullbacks. This chart helps to once again confirm where we want to keep our money. Except for some possible risk profiles that demand some fixed income or for some diversification this chart helps us to know where the strength currently is, which is on the Equity side.
Click on Image to Enlarge
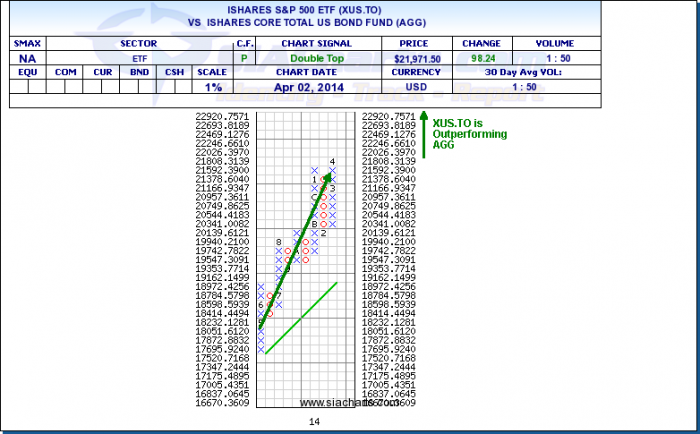
iShares S&P 500 vs. iShares Core Total US Bond (XUS.TO^AGG)
The second comparison chart we are going to look at today is on the U.S. side, once again comparing Equities (XUS.TO) and Bonds (AGG). Although this chart is much shorter in nature, we can see that the trend has been moving upwards in direction in favor of Equities over the past year. Once again, unless there is a need for diversification or a risk profile that demands fixed income, Equities are currently outperforming Bonds on relative strength basis.
The next time that you start hearing all those opinions flying around between the bulls and the bears, create a simple comparison chart and filter out the noise to see what is happening in any relationship that you want to compare. People may have opinions but the charts dont lie.
Click on Image to Enlarge
SIACharts.com specifically represents that it does not give investment advice or advocate the purchase or sale of any security or investment. None of the information contained in this website or document constitutes an offer to sell or the solicitation of an offer to buy any security or other investment or an offer to provide investment services of any kind. Neither SIACharts.com (FundCharts Inc.) nor its third party content providers shall be liable for any errors, inaccuracies or delays in content, or for any actions taken in reliance thereon.
Copyright © SIACharts.com


