In this week's edition of the SIA EQuity Leaders Weekly we are going to revisit 2 key Commodities, Gold and Natural Gas. Both of these Commodities have been weaker over the past year, adding pressure to those equities that benefit or prosper from their pricing. This weakness highlights the importance of the SIA Asset Class Ranking which has seen Commodities at the bottom for multiple years. For those wondering if there may be a bottom in Commodities coming these updated charts can shed some light on the risk vs. reward of that view.
Gold Continuous Contract (GC.F)
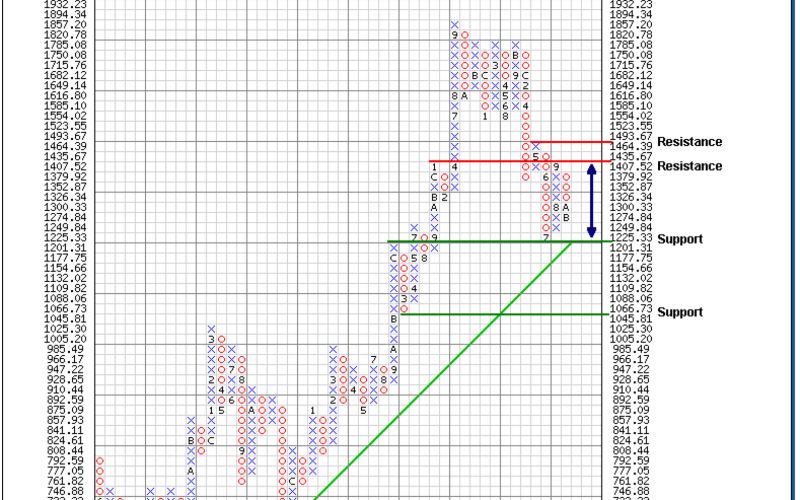
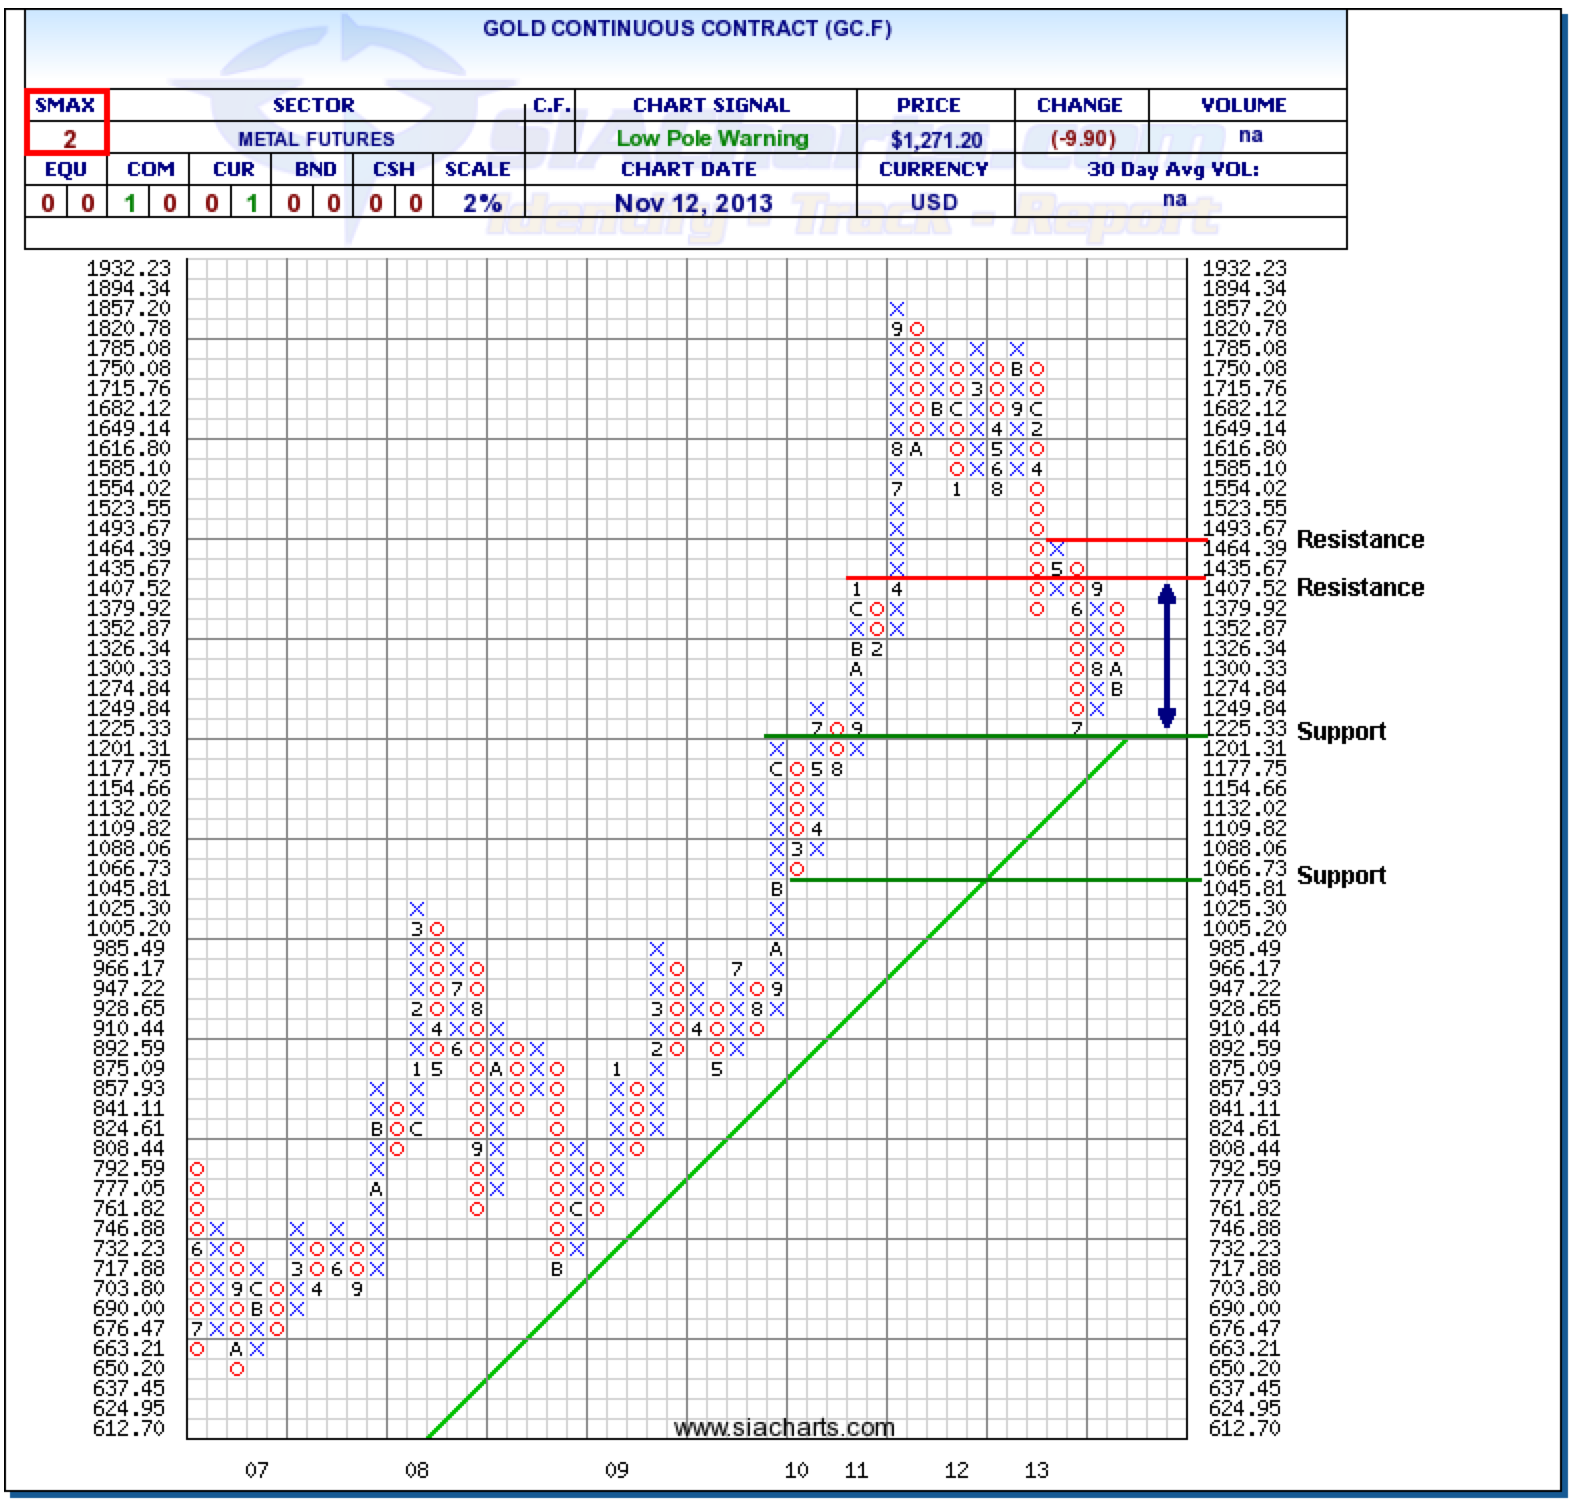
If you take a look back at the past commentary on October 3rd, you can see the current support and resistance levels are identical as we previously highlighted, but that Gold Bullion has moved down 4% more towards the bottom of the channel at the $1201.31 level. Further support is found at $1045.81 should the upwards trend line support break as well. Resistance at the top of the channel remains at $1435.67 and further resistance is also at $1493.67.
With the overall weakness in Commodities, key resistance levels at the top of the trading range (shown by the blue arrow) still represent potential hindrances and the upwards trend line still presents potential support to the downside. However, with an SMAX score of 2 out of 10, GC.F is still showing near-term weakness against all asset classes. This continues the trend we have seen where Gold has not had a positive chart signal for the past two years.
Click on Image to Enlarge
Natural Gas Continuous Contract (NG.F)
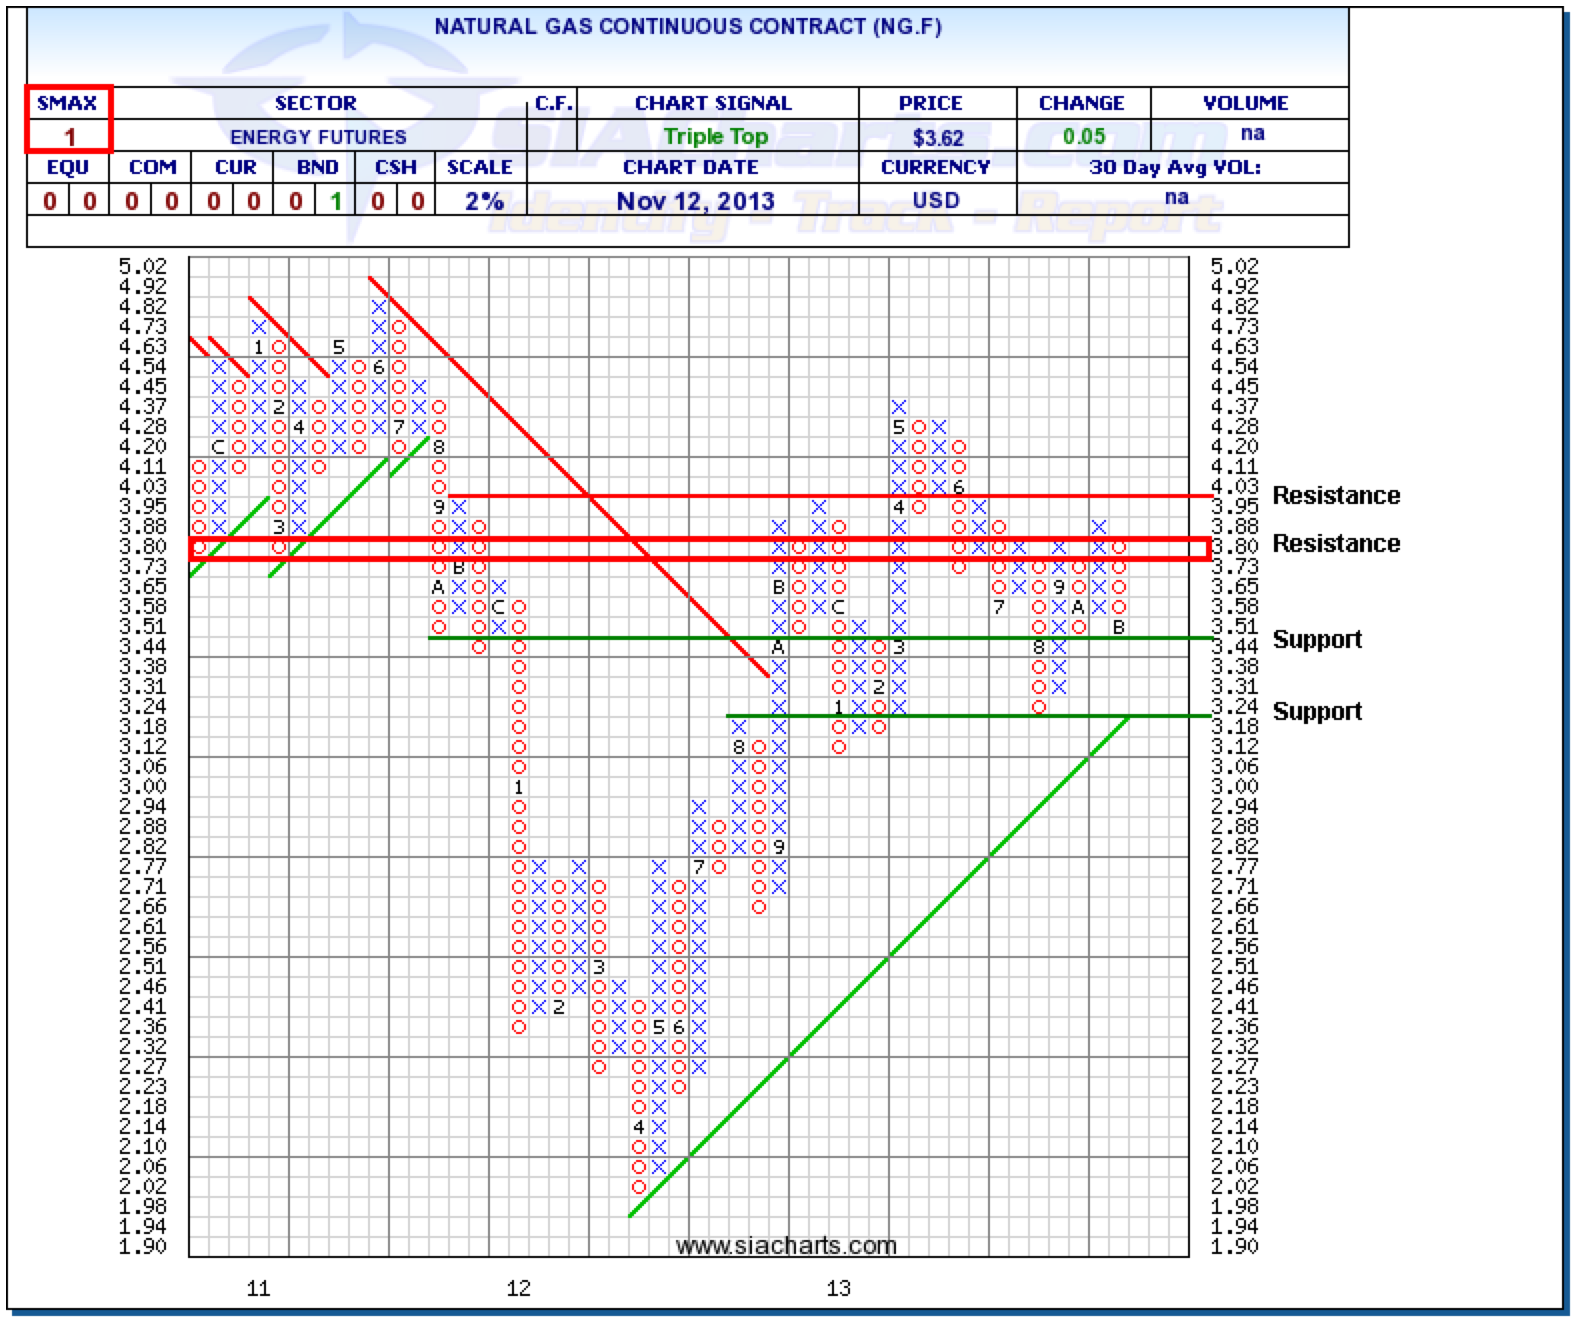
Natural Gas has seen a downwards trend towards some key support levels since we last looked at this commodity. NG.F has now moved down to the first support level at $3.44. If this level holds, the resistance above is found in the $3.80-90 range with another resistance level found at $4.03 at the top of this trading range. The key support level to keep an eye on is found at $3.18 as this is also supported by the upwards trend line.
With the SMAX at a score of 1 out of 10, Natural Gas Continuous Contract is showing near-term weakness against all other asset classes. Since May of this year, NG.F has slowly moved back towards the upwards green trend line and we may want to keep an eye on some of these key trading ranges to see if the weakness continues or the support holds.
Click on Image to Enlarge
SIACharts.com specifically represents that it does not give investment advice or advocate the purchase or sale of any security or investment. None of the information contained in this website or document constitutes an offer to sell or the solicitation of an offer to buy any security or other investment or an offer to provide investment services of any kind. Neither SIACharts.com (FundCharts Inc.) nor its third party content providers shall be liable for any errors, inaccuracies or delays in content, or for any actions taken in reliance thereon.