High Yield and Bank Loan Outlook July 2013
by Guggenheim Partners LLC
July 10 2013
As markets adjust risk premiums amid heightened interest-rate volatility, optimal allocation across the credit quality and yield curve will be paramount.
Despite the parallels being drawn between current credit conditions and those of 2007, the chances of experiencing a sudden spike in near-term defaults, similar to what ensued following the end of the previous credit cycle, remain remote given the robust capital markets activity. While rapidly deteriorating credit quality and excessive market leverage were the chief culprits behind the abrupt end to the previous credit rally, neither factor is currently a significant concern in the leveraged credit market.
Interest-rate risk, specifically the market’s uncertainty regarding future monetary policy, precipitated the recent market sell-off and will likely continue to shape the performance of high yield bonds and bank loans in the near term. Amid increased interest-rate volatility and a gradual softening in underwriting standards, investors should seek to safeguard portfolios by shortening interest-rate duration and improving credit quality. While we continue to view bank loans as the preferred investment vehicle to achieve these dual objectives, the backup in bond yields has created an attractive re-entry point to selectively increase allocations to high yield bonds.
REPORT HIGHLIGHTS:
- The Federal Reserve’s (Fed) announcement of possible tapering as early as the end of 2013 has caused investors to re-price risk. With yields on the 10-year Treasury note 82 basis points higher since May, current market conditions necessitate a greater focus on optimal positioning on the yield curve.
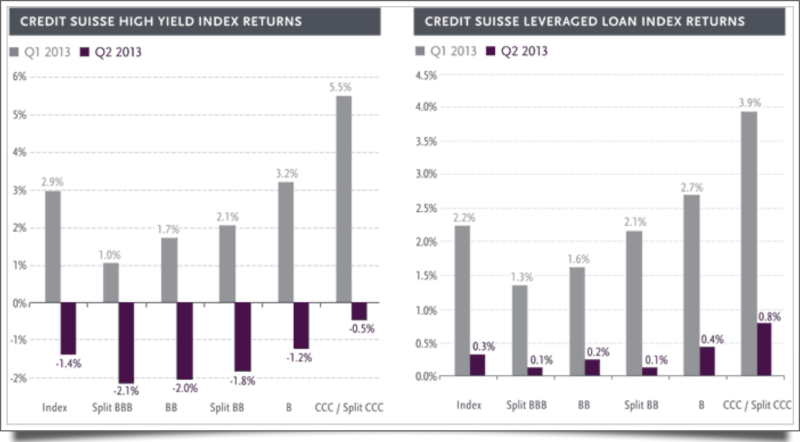
- Investors’ preference for bank loans over high yield bonds is likely to persist until interest-rate volatility subsides. During the second quarter, high yield bonds lost 1.4 percent while bank loans returned 0.3 percent.
- Credit conditions remain relatively benign compared to the experiences of 2006 and 2007. Analyzing market leverage and the financing terms of leveraged buyouts (LBOs) from the respective periods helps illustrate this contrast.
Leveraged Credit Scorecard as of month end
Source: Credit Suisse. Excludes split B high yield bonds and bank loans.
*Discount margin to maturity assumes three-year average life.
Source: Credit Suisse. Data as of 6/30/2013.
Macroeconomic Overview
“Revised first quarter GDP data showed that the contribution from housing-related activities made up 69 percent of the economy’s 1.8 percent growth. With interest rates rising, however, home affordability is plummeting from its recent historic high. Even a flattening of housing activity would cause economic growth to slow materially. This decreases the likelihood that the Fed tapers its asset purchases in 2013.” – Scott Minerd, Global CIO
Concerns Over Imminent Fed Tapering Likely Overblown
Amid a rapid ascent in long-term interest rates beginning in May, high yield bonds dropped 3.2 percent to end the second quarter, the largest two-month decline since September 2011. The severe dislocation in credit markets is the result of investors’ surprise over the faster-than-expected pace at which the Fed indicated plans to taper and eventually end quantitative easing (QE). Instead of waiting for the Fed to act, the markets have preemptively begun to re-price risk. This market reaction is analogous to the experiences of the bond market crash of 1994, when then-U.S. Fed Chairman Alan Greenspan unexpectedly increased the federal funds rate by 25 basis points in February of that year, the first rate increase in five years. In the subsequent bond-market rout – the worst since the Great Depression – investors immediately began re-pricing bonds to where they assumed rates would be at the end of the tightening cycle.
Based on the Fed’s economic projections, which will be used to determine if conditions warrant a change in monetary accommodation, the hysteria regarding imminent tapering may be largely overblown. The Fed’s outlook on the unemployment rate by year end suggests a belief that economic activity will accelerate as we head into the summer. However, we are already beginning to see pressure on housing and the broader economy from higher interest rates. We believe there is a strong possibility that the Fed will shift the tone of its guidance from QE tapering back to QE expansion or extension before the end of 2013. Given the likelihood of sustained interest-rate volatility, investors should look to reduce interest-rate duration through bank loans. Additionally, improved bond market valuations have created opportunities to increase spread duration through select, lower-rated high yield bonds.
Source: Haver Analytics, Guggenheim Investments’ estimates. Data as of Q1 2013. * Housing-related activities defined as private residential investment, personal expenditures on household durable goods and utilities, as well as consumption wealth effect from home price appreciation.
This Time is Different
Significant Differences Between Current and Previous Credit Cycles
It has often been said that the past is the best predictor of the future. Based on this notion, there have been numerous attempts to draw comparisons between the current credit cycle and the previous one in an effort to extrapolate what potentially lies ahead for high yield bonds and bank loans. However, after analyzing the credit conditions of the respective periods, it is apparent that current conditions remain far from the levels of excess that ultimately culminated in the credit crisis. The following table includes a comparison of credit metrics during 2006-2007 vs. 2012-2013. While current credit conditions appear materially more benign across virtually every measure, one metric that notably stands out is market leverage.
Source: Fitch Ratings, JP Morgan, S&P LCD. Data as of 6/30/2013.
While fundamental factors, such as weak operating performance and heavy debt burdens, were the primary catalysts that set off the credit crisis in 2007, the velocity and magnitude of the descent was exacerbated by the excessive leverage in the credit markets. After peaking at $100.11 in February 2007, the Credit Suisse Leveraged Loan Index went into a freefall, declining nearly 40 percent by the end of 2008. In the years preceding this collapse, bank loan investors had grown increasingly more aggressive in seeking ways to augment their returns. Seemingly calm credit conditions encouraged investors to utilize leverage as a means to enhance bank loan returns. Similar to buying on margin, total return swaps (TRS) enabled institutional investors to participate in the ongoing credit rally on a leveraged basis, typically obtaining 8-10x leverage on their equity. However, as bank loan prices reversed course and began to fall precipitously, TRS investors received margin calls. Forced to either post additional equity or sell bank loan holdings to raise cash, most investors chose the latter option, resulting in further price degradation. In addition to highly leveraged institutional investors, investment banks also became forced sellers in the bank loan market.
During the LBO boom years of 2006 and 2007, investment banks routinely committed capital in the form of bridge loans to help secure lucrative underwriting mandates. Bridge loans are short-term bank loans that provide interim financing until more permanent funding is secured. During normal market conditions, these bridge loans are quickly repaid through syndicated financings from institutional investors. According to JP Morgan estimates, banks’ total committed capital exceeded $330 billion at its peak. As investor demand for risk assets began to sour in late 2007, banks were unable to raise long-term financing to take out these bridge loans, the majority of which had been issued to highly leveraged companies. With risk exposures ballooning, banks acquiesced to mounting regulatory concerns and began selling these loans at significant discounts. This placed excess supply on the market at a time of shrinking demand, compounding the volatility and downward price spiral in the bank loan market. Comparing the deal metrics of H.J. Heinz and TXU, the largest LBOs of their respective periods, highlights the difference between current credit conditions and those of 2007.
Source: Fitch Ratings. Data as of 6/30/2013
Optimal Portfolio Positioning
Bank Loans Remain Our Preferred Investment Vehicle
While far from the excesses of 2006-2007 from a credit underwriting and market leverage perspective, investors, nonetheless, need to be cognizant of the current dynamics that are likely to impact performance. While we are monitoring the slight deterioration in underwriting standards, we believe this is a secondary, longer-term concern. In the near term, defaults should remain muted, given the preponderance of refinancing activity over the last three years. We anticipate monetary policy, and its attendant implications on interest rates, will continue to be the primary driver of credit markets over the next several years.
Our preferred investment vehicle to mitigate interest-rate risk continues to be bank loans. The floating-rate coupons of bank loans provide greater protection against movements in interest rates. Due to their seniority in the capital structure, maintenance covenants, and secured status, we consider single B-rated bank loans to be of comparable credit risk to BB-rated bonds. Since rates began moving higher in early May, interest-rate sensitive BB-rated bonds have declined 3.9 percent, while single B-rated bank loans were essentially flat.
Source: Credit Suisse. Data as of 6/30/2013
Despite covenant-lite loans representing 53 percent of 2013 year-to-date total loan issuance, we believe concerns over this apparent relaxation in underwriting are largely overstated. This trend is likely more symptomatic of shifting capital market dynamics and investor demand than worsening credit quality. Based on their default and recovery characteristics, covenant-lite bank loans are very similar to senior secured bonds. The strong retail demand for floating-rate assets and robust collateralized loan obligation (CLO) creation have incentivized issuers to raise debt financing through the bank loan market over the bond market. Bank loan issuance, currently totaling $395 billion year-to-date, is on track to exceed bond issuance for the first time since the financial crisis. The shorter call protection periods and smaller call premiums of bank loans have also influenced greater loan issuance.
Our long-standing belief that the unprecedented monetary accommodation from global central banks would eventually give rise to increased market volatility has come to fruition. Now that volatility has finally arrived, this will likely increase the demand for bank loans. Our portfolios remain positioned accordingly, with an overweight bias in bank loans. While largely staying the course, we remain poised to take advantage of market pullbacks to selectively add exposure to fundamentally strong credits. The recent 140 basis point backup in bond yields over the past two months has helped create more favorable valuations, particularly in single B-rated bonds. As the market struggles to determine the appropriate risk premium during this period of interest-rate uncertainty, our focus remains on optimal investment allocation across the credit quality and yield curve
IMPORTANT NOTICES AND DISCLOSURES
Past performance is not indicative of future results. There is neither representation nor warranty as to the current accuracy or, nor liability for, decisions based on such information. This article is distributed for informational purposes only and should not be considered as investment advice, a recommendation of any particular security, strategy or investment product or as an offer of solicitation with respect to the purchase or sale of any investment. This article should not be considered research nor is the article intended to provide a sufficient basis on which to make an investment decision. The article contains opinions of the author but not necessarily those of Guggenheim Partners, LLC its subsidiaries or its affiliates. The author’s opinions are subject to change without notice. Forward looking statements, estimates, and certain information contained herein are based upon proprietary and non-proprietary research and other sources. Information contained herein has been obtained from sources believed to be reliable but is not guaranteed as to accuracy. The value of any financial instruments or markets mentioned in the article can fall as well as rise. Securities mentioned are for illustrative purposes only and are neither a recommendation nor an endorsement. Individuals and institutions outside of the United States are subject to securities and tax regulations within their applicable jurisdictions and should consult with their advisors as appropriate.
Guggenheim Investments represents the following affiliated investment management businesses of Guggenheim Partners, LLC (“GP”): GS GAMMA Advisors, LLC, Guggenheim Aviation, Guggenheim Funds Distributors, LLC, Guggenheim Funds Investment Advisors, LLC, Guggenheim Partners Investment Management, LLC, Guggenheim Partners Europe Limited, Guggenheim Partners India Management, Guggenheim Real Estate, LLC, Security Investors, LLC and Transparent Value Advisors, LLC. Guggenheim Partners Investment Management, LLC (GPIM) is a registered investment adviser and serves as the adviser to the Core Fixed Income Strategy. GPIM is included in the GIPS compliant firm, Guggenheim Investments Asset Management, and is also a part of Guggenheim Investments. This material is intended to inform you of services available through Guggenheim Investments’ affiliate businesses. No part of this article may be reproduced in any form, or referred to in any other publication, without express written permission of Guggenheim Partners, LLC. ©2013, Guggenheim Partners, LLC.