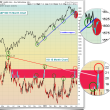
Europe had a good day today after a rough Friday, but Asian indices posted declines after a strong Friday. So where do markets around the world currently stand within their normal trading ranges? Below is an updated look at our country ETF trading range screen. A detailed description of how to read the chart is provided at the bottom of this post, but basically, the red area is overbought territory while the green area is oversold territory. The black neutral (N) line represents each ETF's 50-day moving average.
As shown, the US (SPY) and Japan (EWJ) are currently the only key countries trading above their 50-day moving averages. Nearly all of the remaining 28 country ETFs are in oversold territory. While we've seen a nice bounce back here in the US off of the June 24th low, the rest of the world is still struggling to find its footing.
Copyright © Bespoke Investment Group