Fund Managers Are Alarmingly Bullish!
Last time I updated the ever popular Merrill Lynch Fund Managers Survey was in late January. A common occurrence was the high levels of risk taking, a non-desire for market protection, high expectations of growth in China and finally a trend of overexposure towards equities. In the February report, the pro-risk theme continued as an extremely low number (1 in 10) of fund managers saw an increased risk towards a recession (usually a great contrary sign that we are on the cusp of one). Complacency was further noticed with the report stating that:
"Managers clearly want companies to pursue growth: 48% say companies should use cash to increase capital expenditure (capex) versus just 12% demanding debt repayment."
If one was to place these numbers into a historical context of the survey, the last time we saw this many managers wanting a capex increase was in April 2011 - just as all global markets peaked and corrected by around 20%. Furthermore, the last time we saw such a small number of managers wanting debt repayments (balance sheet improvements) was in the middle of 2007 - on the cusp of a global financial crisis. As we refocus towards the March 2013 survey, a risk taking theme is not only clear, but has now become euphoric. Let us go through some of the charts I have put together:
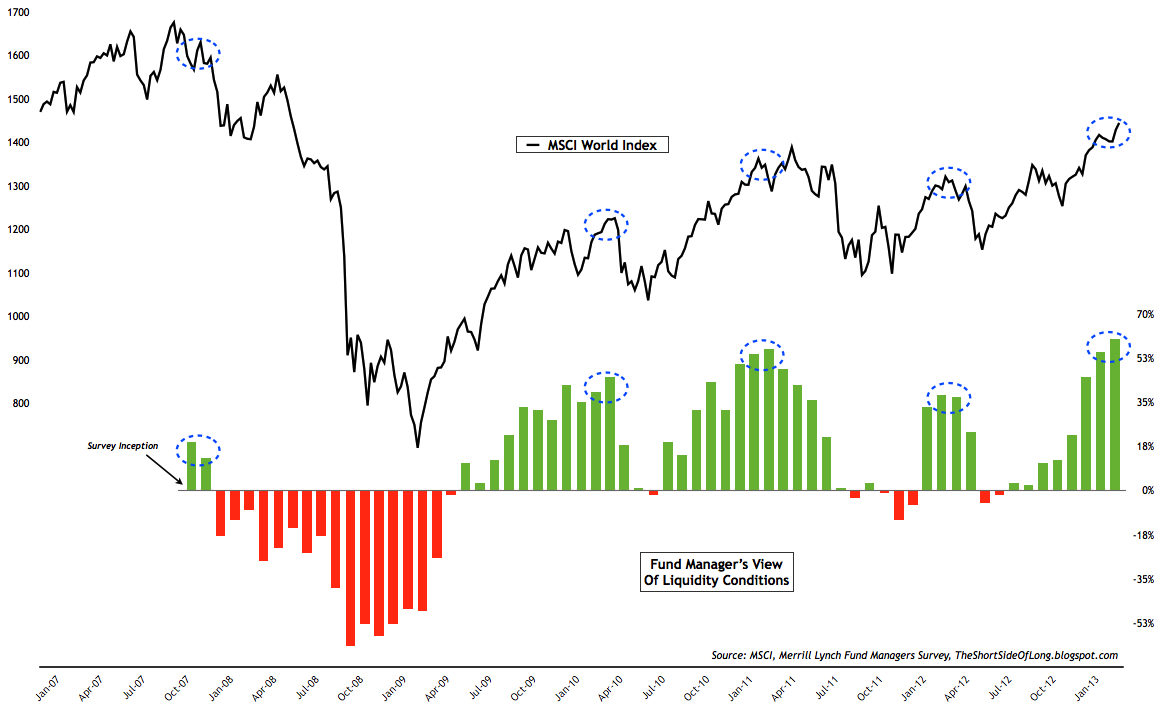
Chart 1: Is this as good as it gets liquidity wise?
Source: Short Side of Long
While the survey was started in the early 2000s, Merrill Lynch only started tracking perceived conditions like depth and volume, narrowness of bid offer spreads and ease of execution as of 2007. The chart above shows that the current liquidity conditions are at record readings. Retail investors love the good days, but us contrarians should know that when it gets as good as it currently is - the end is near.
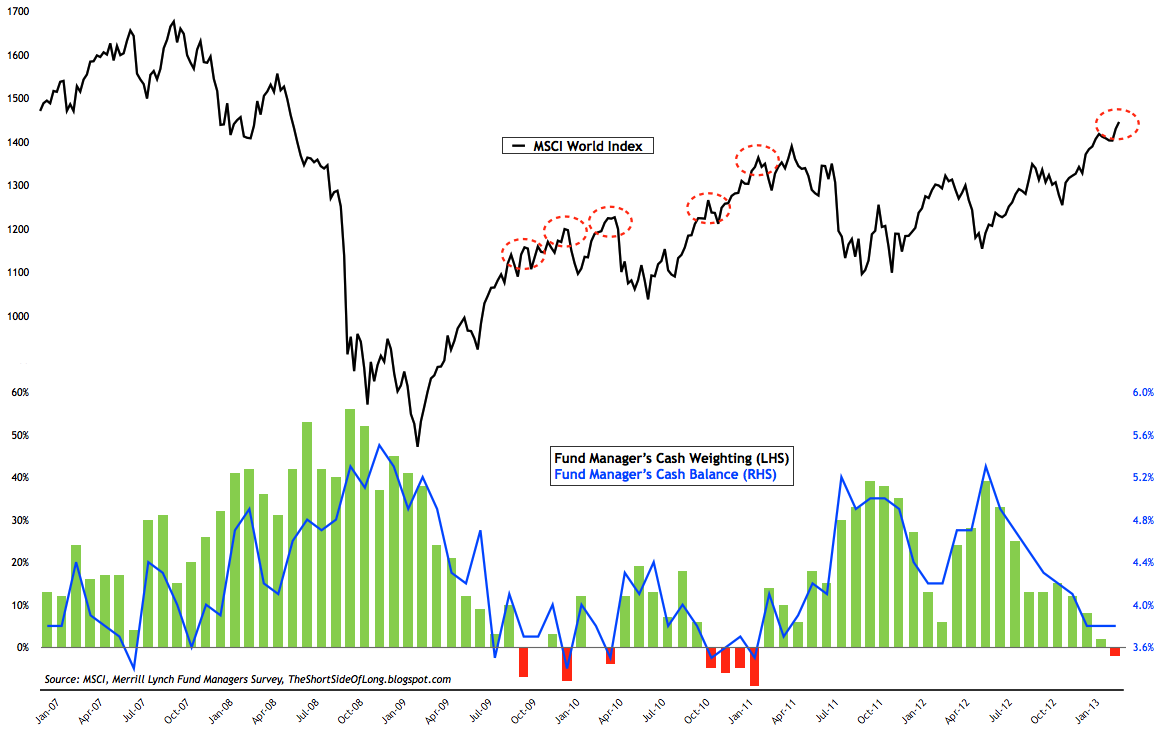
Chart 2: Cash levels are at complacent lows
For the first time since February 2011 (major market peak), global fund managers are now underweight cash. Furthermore, cash balance levels have fallen towards 3.8%, from the highs of 5.5% about a year ago. The above charts shows that the majority of funds are now close to fully invested.
With that in mind, it is definitely worth finding out where fund managers have exposed their capital?
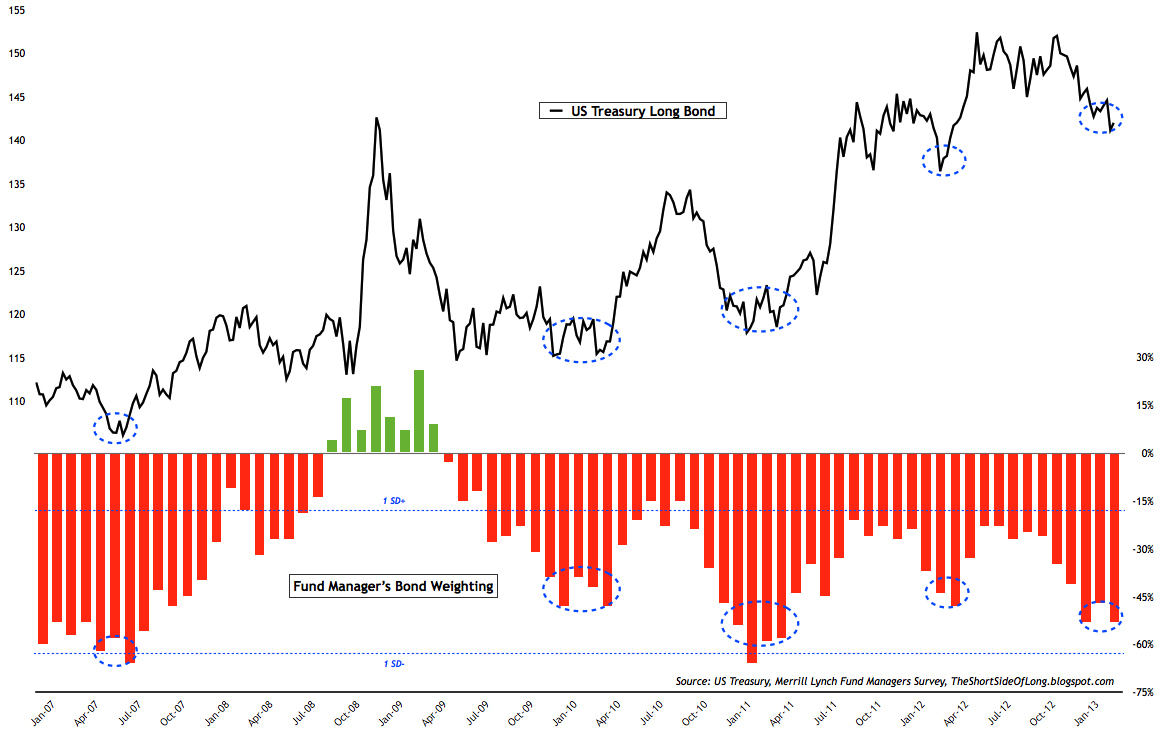
Chart 3: Are fund managers investing in Bonds? No.
According to the March 2013 survey, global fund managers hold a 53% underweight exposure to the bond market. This is now the lowest exposure since April 2011, just as equities and commodities peaked while bonds bottomed. Therefore, we can safety assume that managers have been selling bonds towards extreme levels of underexposure and rotating capital into other pro-risk assets.
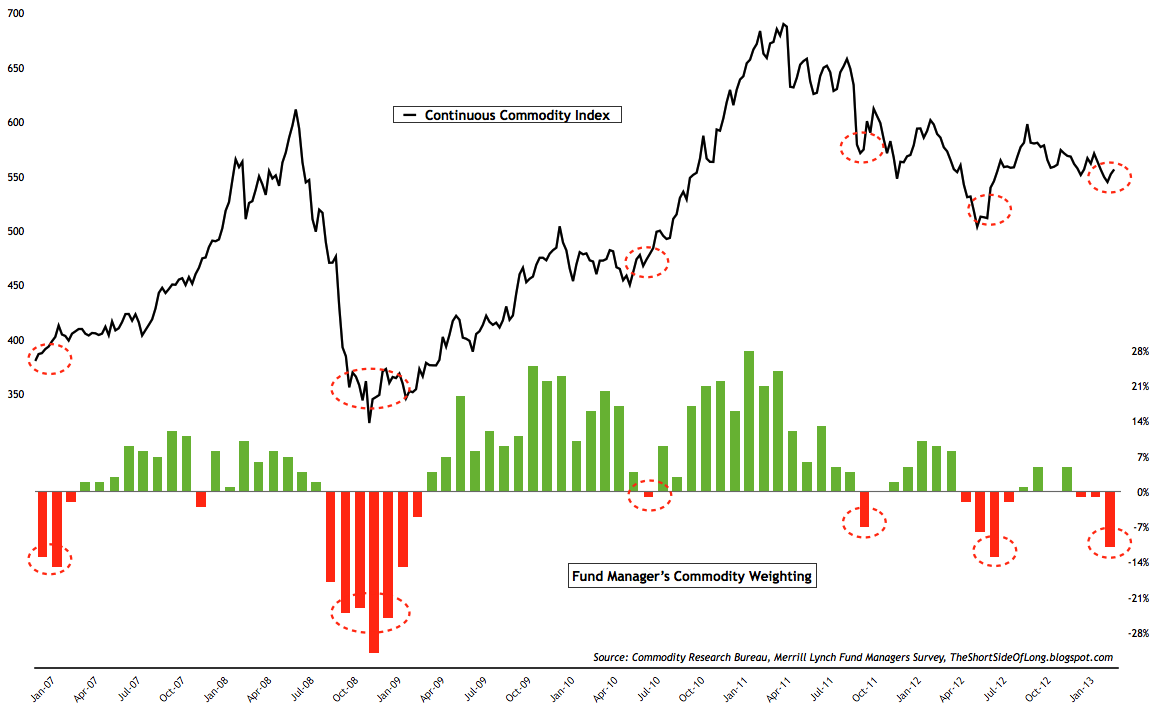
Chart 4: Are fund managers investing in Commodities? No.
Source: Short Side of Long
The recent survey also noted that global fund managers hold a 11% underweight exposure to the commodity market. Managers are bearish on commodities and hold the lowest exposure since the June 2012 bottom. Of high interest to Precious Metals investors, the survey asked managers to rank what is likely to occur first within the current macro economic environment. Over 40% think the Yen will keep falling, close to 20% think the US will suffer another downgrade and Spain will be bailed out, while only 2% of global fund managers believe Gold will reach $2,000. As a PMs investor, I personally like to be on the other side of the boat.
As a side note for those who still remain invested in the PMs secular bull market, it is also worth noting that the March 2013 survey shows that global fund manager's expectations of a further US Dollar appreciation, reached record high level (dating back a decade of survey data).
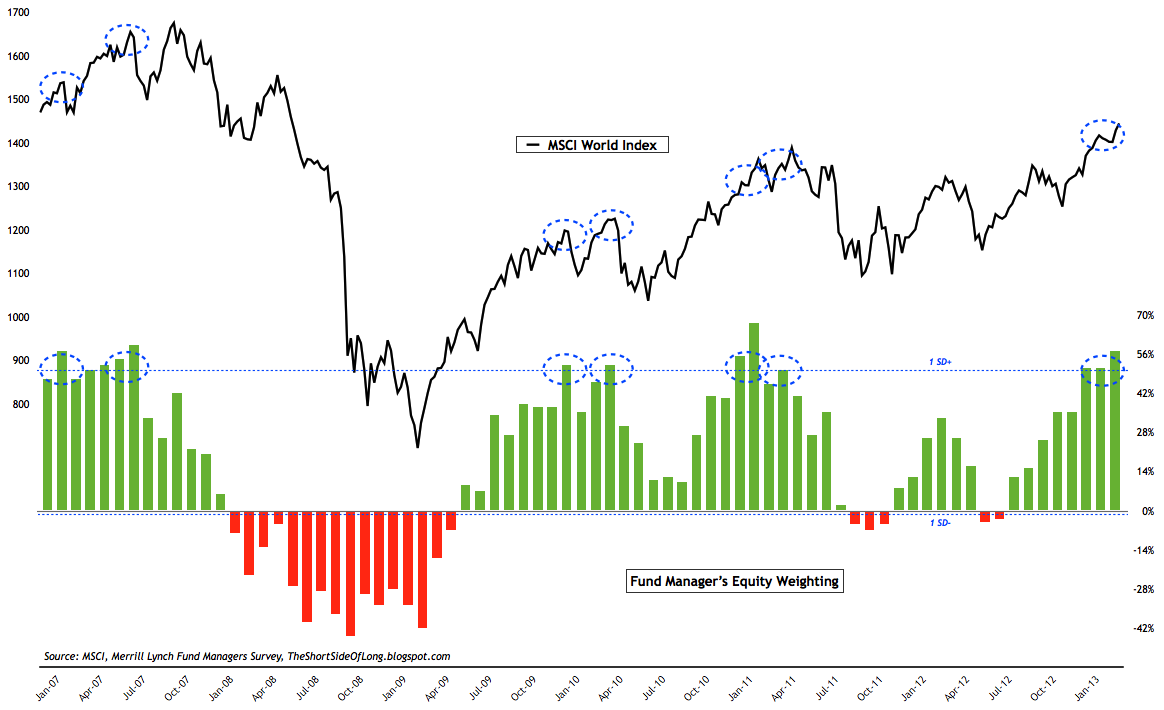
Chart 5: Are fund managers investing in Stocks? A big YES!
Exposure to global equities has now reached euphoric levels, last seen in February 2011 during the QE2 days. A net 57% of managers are now overweight equities, which is extremely high relative to the 4% underweight exposure seen in June 2012. More importantly, exposure of fund managers has been at extreme levels (1 standard deviation above the ten year average) for three months in the row and forced liquidation could occur quite easily.
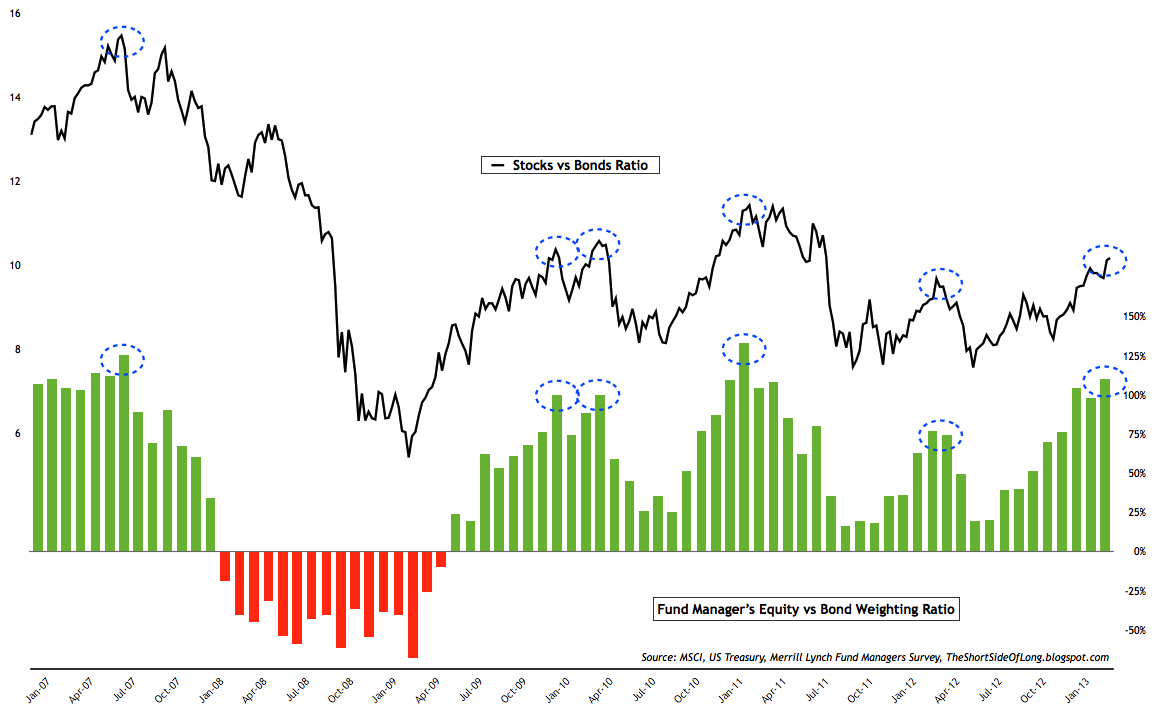
Chart 6: Weighting spread between stocks & bonds are at extremes!
Source: Short Side of Long
According to the survey, it seems that global fund managers have been selling bonds (and commodities), while overexposing themselves to equities. The spread between long equity overweight and short bond underweight is now reaching levels last seen during the 2007 and 2011 market peaks.
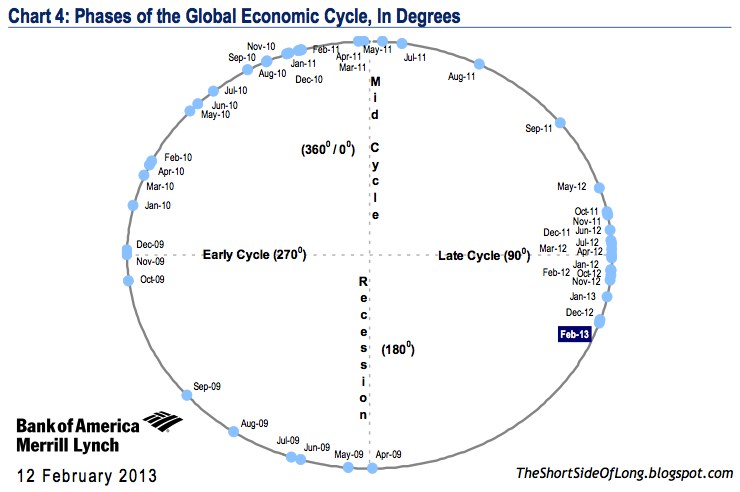
Chart 7: We are now on the cusp of a recession
Source: Merrill Lynch & Short Side of Long
The Bottom Line
Most investors are probably looking at the charts above and admitting that a correction is possible. They agree that managers have overexposed themselves to equities and one should prepare for a pullback.
I tend to agree that overexposure towards assets creates corrections from a contrarian point of view, as many circles show in various charts above. However, I would like to remind investors that overexposure towards equities at the end of the business cycle (refer Chart 7), usually leads to a bear market (a sell off of 20% or more) rather than just a quick corrective process.
Finally, Merrill Lynch reports that allocations to alternative investments such as art, wine and so forth, are now at close to 5-year highs (last seen just before the Lehman Collapse).
What I Am Watching
Copyright © Short Side of Long


