


![]()
SIA Charts Daily Stock Report (siacharts.com)
The SIA Daily Stock Report utilizes a proven strategy of uncovering outperforming and underperforming stocks from our marquee equity reports; the S&P/TSX 60, S&P/TSX Completion and S&P/TSX Small cap We overlay these powerful reports with our extensive knowledge of point and figure and candlestick chart signals, along with other western-style technical indicators to identity stocks as they breakout or breakdown. In doing so we provide our Elite-Pro Subscribers with truly independent coverage of the Canadian stock market with specific buy and sell trigger points.
Note: Subscribers can screen all Canadian and U.S. stocks and mutual funds, or as components of equally weighted mutual fund sectors indices (e.g. Income Trusts, Precious Metals), and fund groups by issuer (eg. AGF, Dynamic, Franklin Templeton), all Canadian ETFs, ETF Families by issuer (iShares, Horizons, BMO) or as components of Equally Weighted ETF Sector Indices (e.g. 2020+ Target date, Cdn Equity Lg Cap), and create and monitor their own, or SIA's existing model portfolios. Finally, subscribers benefit from being able to generate BUY-WATCH-SELL Signals on demand with SIA Charts proprietary Favoured/Neutral/Unfavoured, SMAX scoring algorithm (see green-yellow-red graph 1 below).
EBAY INC (EBAY) NASDAQ - Feb 08, 2013
GREEN - Favoured / Buy Zone
YELLOW - Neutral / Hold Zone
RED - Unfavoured / Sell / Avoid Zone
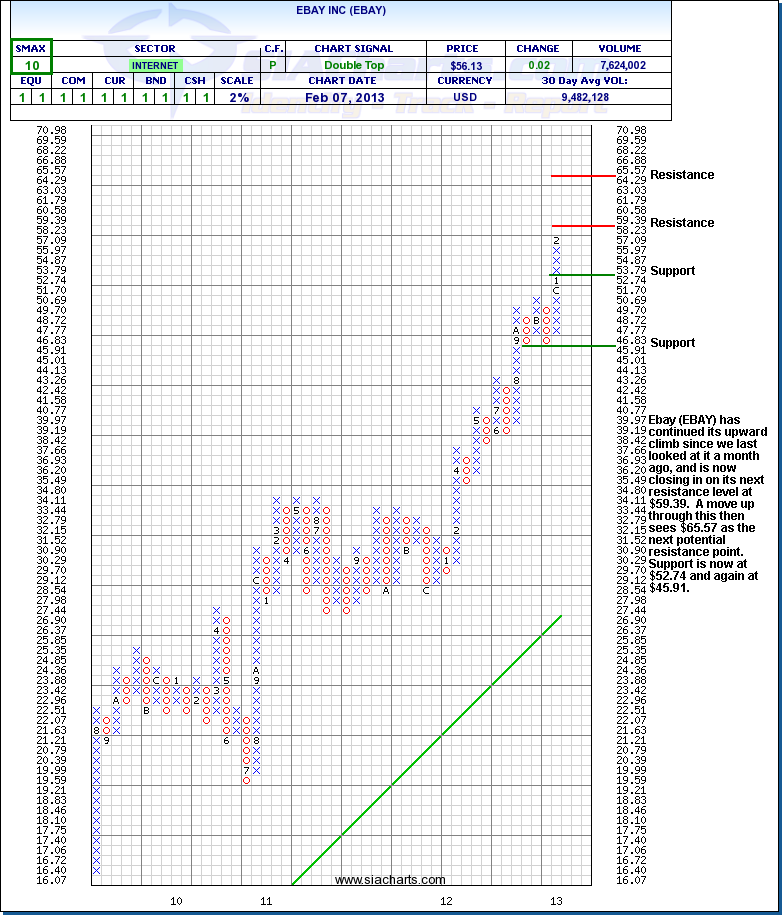
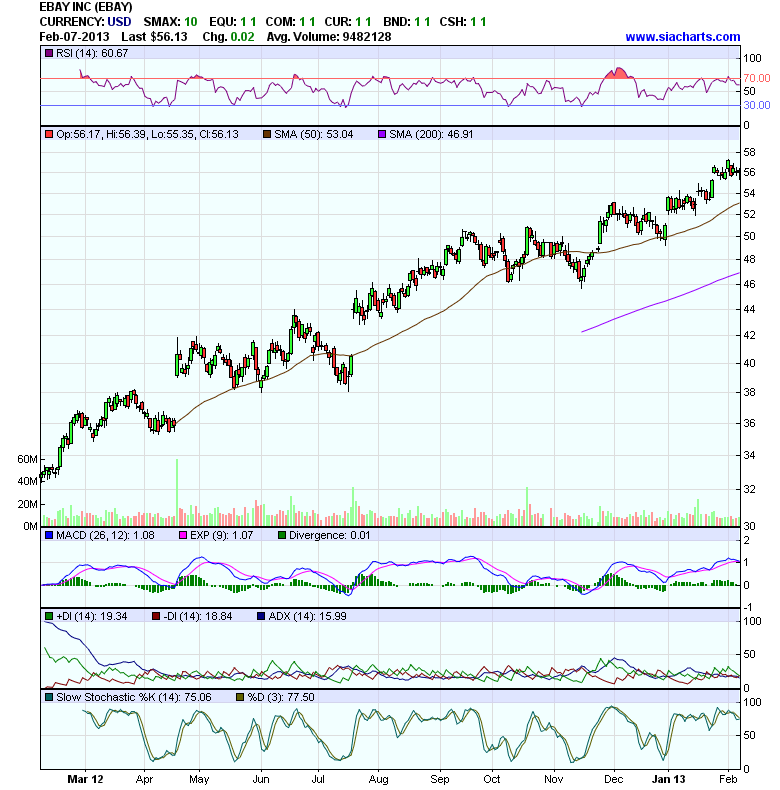
EBAY INC (EBAY) NASDAQ - Feb 08, 2013 - Ebay (EBAY) has continued its upward climb since we last looked at it a month ago, and is now closing in on its next resistance level at $59.39. A move up through this then sees $65.57 as the next potential resistance point. Support is now at $52.74 and again at $45.91.
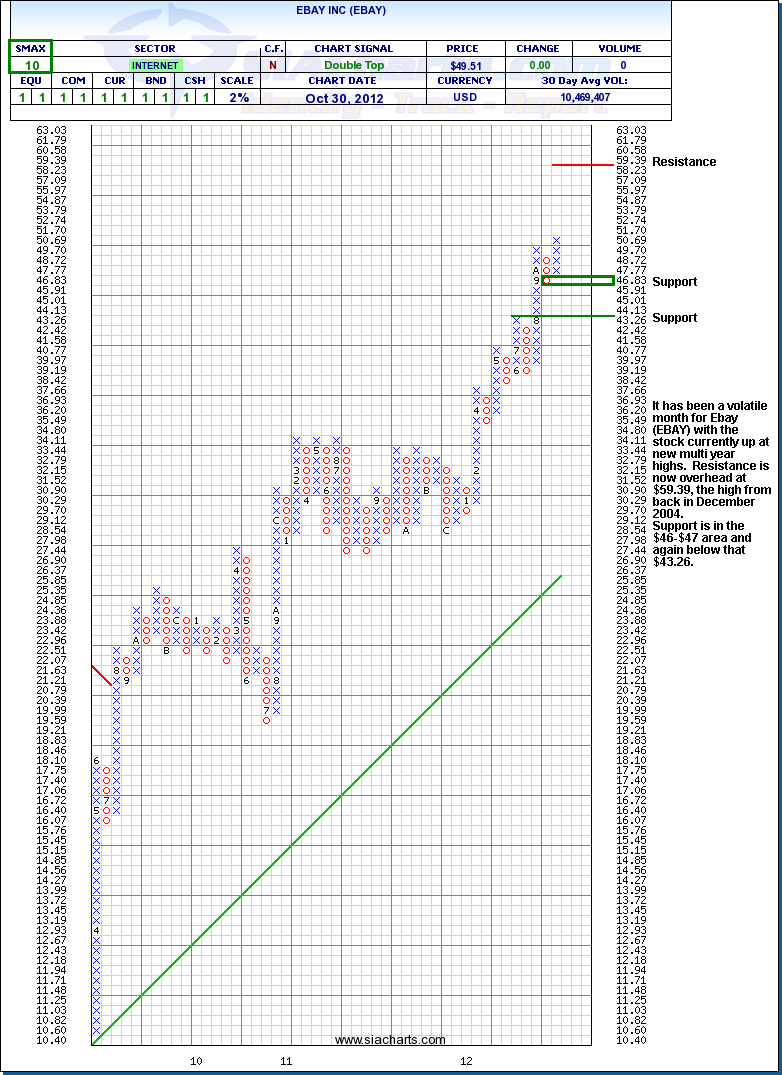
It has been a volatile month for Etaay (EBAY) with the stock currently up at new multi year highs. Resistance is now overhead at $59.39, the high from back in December 2004. Support is in the $46-$47 area and again below that $43.26.
Important Disclaimer
SIACharts.com specifically represents that it does not give investment advice or advocate the purchase or sale of any security or investment. None of the information contained in this website or document constitutes an offer to sell or the solicitation of an offer to buy any security or other investment or an offer to provide investment services of any kind. Neither SIACharts.com (FundCharts Inc.) nor its third party content providers shall be liable for any errors, inaccuracies or delays in content, or for any actions taken in reliance thereon.
Copyright © siacharts.com


