


![]()
Real-Life Example of Finding Upward Surprises (NFLX)
and Avoiding Downward Surprises (AAPL) with SIACharts
by Paul Kornfeld, SIA Charts
You may have been noticing SIACharts has been providing daily technical analysis charts on Advisor Analysis for a couple months now, but maybe you have never taken the time to really see the value the charts are showing you or that the full SIA system provides to many investment advisors across Canada. This morning, we are going to take a look at two U.S. Equities, Apple and Netflix, that everyone is hearing about in the news. This technical viewpoint might show you something different than what many media sources are saying and is a timely example on how relative strength and technical analysis can help you in the future for when to get in and out of different stocks you may own or are looking to own.
Downward Surprise: APPLE
Apple Inc. (AAPL) has been a holding that SIA has recommended as a Buy and Hold for almost four years since March of 2009. On March 11, 2009, AAPL moved into the favored zone of the SIA S&P 100 Report at $92.68 and hit our buy opportunity on March 15, 2009 at $95.42. It stayed in the favored zone until just two and a half months ago as you can see in the chart below.
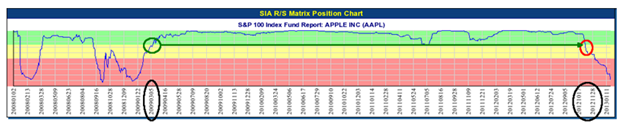
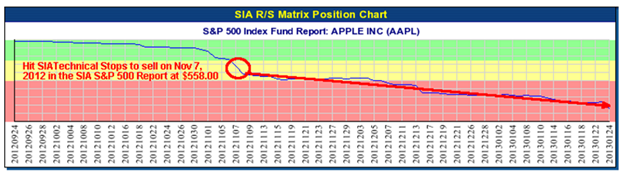
But, the SIA system saw relative weakness against its peers when Apple moved out of the Favored zone and hit our technical stops to sell Apple on November 7, 2012 at $558.00 as seen in the chart below.
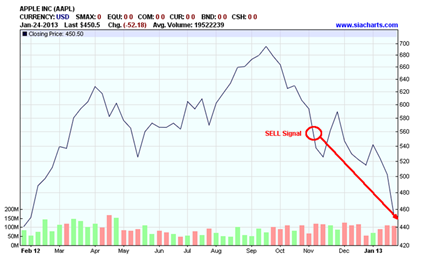
Since this time, Apple has continued to fall and had its largest one day loss in five years on January 24supth/sup, 2013 losing over 12% and an estimated $65.8 billion dollars in market cap. Since our SIA sell signal on November 7supth/sup, Apple has fallen another 19.3% to $450.50.
So what does the future hold for Apple from a technical standpoint? Well, the long-term relative strength is weak for Apple compared to its peer group as it is now found near the bottom of all SIA Relative Strength Reports for an outlook of the next 6-18 months. In the Point and Figure chart seen below, support can be found above $412.83 and above $396.80. If needed, another level of support can be found at $359.39. To the upside, resistance is found at $493.37 and at $534.04 should the weakness reverse. The near-term indicator (SMAX score) has a score of 0 out of 10 giving no indication that the strength will reverse in the next 1-90 days without a fundamental change.

So should you buy into Apple in this period of weakness and hope it turns around? The short answer is NO according to the SIA Relative Strength Reports. These reports and Relative Strength technology can help give you a system and a set of rules to follow to know when the right time is to help reduce your risk of the downward surprises that we just saw with Apple. If you had been using the SIA system over the last five years and entered into the Apple at $95.42 when our system suggested it and got out at $558.00, you would have captured a 484.8% return in just under four years and saved the recent downfall by 19.3% protecting your clients.
Upward Surprise: NETFLIX
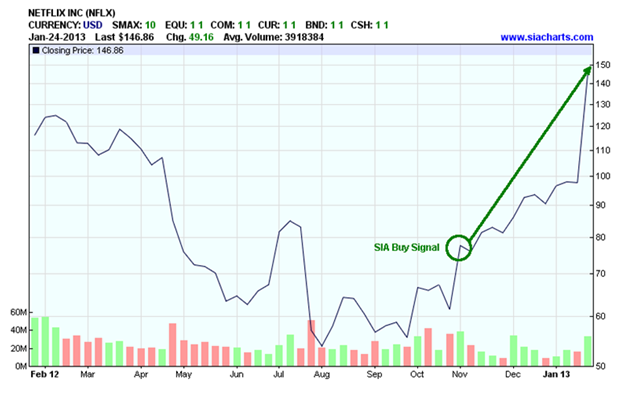
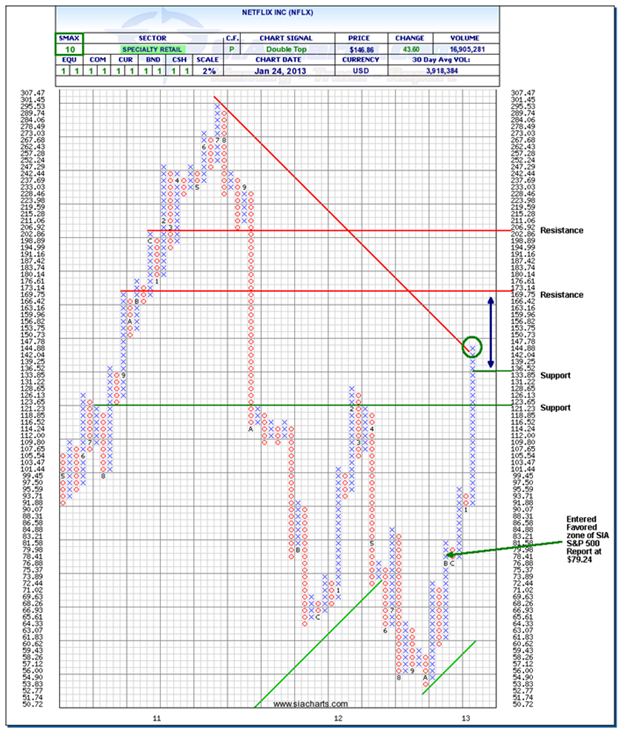
Around the same time period that our system was suggesting to sell Apple, Netflix (NFLX) began to move up the SIA Reports and entered the Favored zone of the SIA S&P 500 Report on Oct 31, 2012 at $79.24.
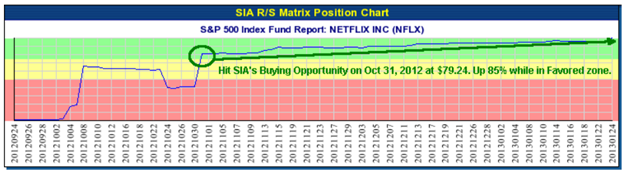
You can see on the chart below that the momentum has not slowed down and on January 24, 2012, NFLX had a 42.2% run after better than expected earnings. Although technical analysis doesn't take into account the earnings, what the SIA Relative Strength system can do for you is help you find stocks like Netflix that increase your chance of a positive report coming out as the technicals can help show the positive or negative money flow before these announcements.
What does the future look like for Netflix? Is it too late to buy in? Well, many people get stuck on the notion that they have missed the big opportunity or the big run and that stock can only go down because it is overbought. Although, sometimes this may be true (buyouts, mergers, acquisitions are prime examples usually), using the point and figure chart below, we can see that there is still positive indication that the run with NFLX may not be done. Resistance above is found at $173.14 and above this at $206.92 which is the target objective. Support to the downside is found at $133.85 and at $121.23. The near-term (SMAX score of 10) and all other secondary indicators on our system also show positive.
Although SIACharts never recommends the buying/selling of any investment, hundreds of advisors across North America rely on SIACharts to help them with finding the best investments to be in and more importantly when to possibly exit the position and look for better opportunities. Using these examples above, in just two and half months, SIACharts could have helped you with a strong104.6% swing/strong (+85.3% in NFLX trade and -19.3% in AAPL trade). span style="text-decoration:underline"Using SIA's system, you can help increase your odds of finding these positive upward surprises and help decrease your chances at the negative downward surprises like these two examples showed today/span.
Contact SIACharts today at siateam@siacharts.com to learn more or sign up for a FREE two-week trial to get full access to the system and have a personal walk-through with one of the Support staff to help you understand how it can be fully customized to fit your unique investment practice.


