January 2, 2013
by Liz Ann Sonders, Senior Vice President, Chief Investment Strategist, Charles Schwab & Co., Inc.
Key Points
- No "grand bargain," but Congress got a deal done at the 13th hour to avert the fiscal cliff.
- The next two months will bring more DC wrangling and likely market angst, but we believe the outlook has brightened for the economy and market in 2013.
- The "wall of worry" is alive and well.
We've been suggesting that the fiscal cliff was actually more like a fiscal slope, but in reality—given that a deal was struck near midnight on the first of the year—it was really more like a fiscal bungee jump. Technically, we went off the cliff for a day, only to be pulled back up by the deal approved by both the Senate and House. I'll leave the details of the plan to Mike Townsend, who wrote about it in today's Schwab Investing Brief, but today's report will serve as an outlook of sorts for 2013, now that we have the initial deal to avert the cliff.
Unfortunately, we're not out of the woods in terms of the grip Washington DC has on the economic, market and psychological outlook, given that the debt ceiling and spending fights will still rage over the next couple of months. We really just crossed a bridge to the other side and are now facing the debt ceiling/sequestration cliff.
But I can now share my thoughts on the year ahead with at least a little more clarity than we had even yesterday.
New drag to replace old drag
Let's first tackle the economic impact of the deal. Estimates of the fiscal drag coming this year are hovering around 1% of gross domestic product (GDP), but that needs to be put into context relative the past several years. The table below represents the impact of the huge 2009 stimulus package on the economy.
GDP Impact of 2009 Stimulus Package

Source: High Frequency Economics, as of January 2, 2013. Data represents calendar year averages and Congressional Budget Office estimates based on mid-points of ranges.
As you can see, the US economy has already been experiencing about a 1% fiscal drag since 2011 from the winding down of the 2009 bill, which is set to wane in 2013. The drag from state and local budget cuts is also waning, but these are now being "replaced" by the 1% or so drag from the bill averting the cliff. In other words, we've been walking down the fiscal-drag road for some time now, and this year won't be much different.
There's a small range of widely published forecasts for 2013 US GDP growth, from 2.0% from the Survey of Professional Forecasters, 2.3% from Blue Chip Consensus and 2.7% from the Federal Open Market Committee. I think it's a reasonable range for the first half of 2013, but I wouldn't be surprised to see a higher growth rate in the second half, unless inflation picks up (see "risks" section below).
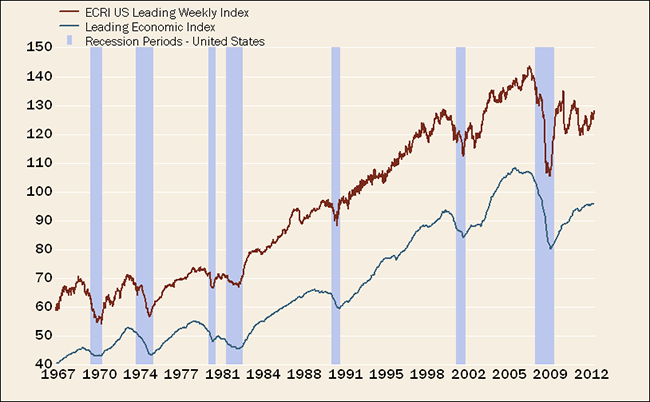
In the immediate aftermath of the deal, many economists are adjusting their views on the likelihood of recession. I wasn't in the recession camp myself, assuming we got even a partial deal to avert the cliff. Not only has a recession never occurred with housing rebounding as sharply as it is presently, but the two most widely followed leading indexes are also not sending recession signals, as you can see below.
No Recession Signaled by Leading Indicators

Source: Economic Cycle Research Institute, FactSet, The Conference Board, as of December 28, 2012.
Pent-up demand?
Then there are the confidence effects, which are less direct. I've written often recently about the wide gap that developed between weak business confidence and more-resilient consumer confidence. If the former receives a boost now that a cliff deal has occurred and/or once we get past the debt-ceiling deadline, the pent-up demand that could be unleashed might make the second half of 2013 quite a bit brighter than is currently expected.
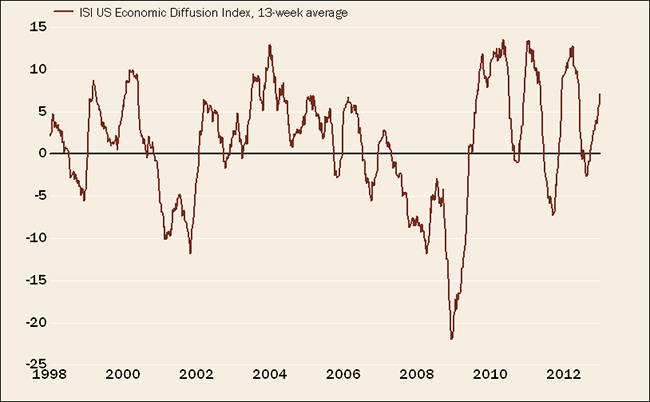
In the meantime, meaningful green shoots have sprouted that have kept consumer confidence up, boosted third-quarter GDP, and are continuing to hum as we head into 2013. This is reflected in ISI's Economic Diffusion Index, which tracks several dozen high-frequency economic indicators and is a strength-minus-weakness measure.
Growth Scare Averted Again

Source: FactSet, ISI Group, as of December 31, 2012.
As you can see, we've yet again rebounded out of the mid-year slump that has characterized the past three years.
Massive monetary policy easing
Monetary policy easing the past few years has been unprecedented, and more recently, global in nature. The Federal Reserve, thanks to its latest round of quantitative easing (QE3.1) is now buying $85 billion in mortgage and Treasury securities each month, with additional global easing expected. According to ISI, over the past 16 months, 327 stimulative policy initiatives announced globally, an under-discussed offset to the fiscal drag.
Global central banks are flooding the world with liquidity and low interest rates … this money must go somewhere. As returns on "fixed" investments diminish, and with global stock markets strong, this year could finally see some increased interest in stocks relative to bonds, at least in terms of fund flows.
Wall of worry
Maybe most important for investors has been the stock market's performance, continuing in earnest today as I pen this report. The S&P 500 Index's total return was a very strong 16% in 2012. Stocks and housing are the two largest components of household net worth, and with both humming, the net worth bounce has contributed mightily to the confidence bounce.
I will write it again: this has been one of the most unloved bull markets I've witnessed in the nearly 27 years I've been in this business. If there was ever an example of how markets "climb a wall of worry," the past four years are testament to that! The bottom line is that at some point, all the negative news gets priced in. A perfect example would be the performance of Greece's stock market, up 33% in 2012—the best among the eurozone nations!
Risk-averse investors
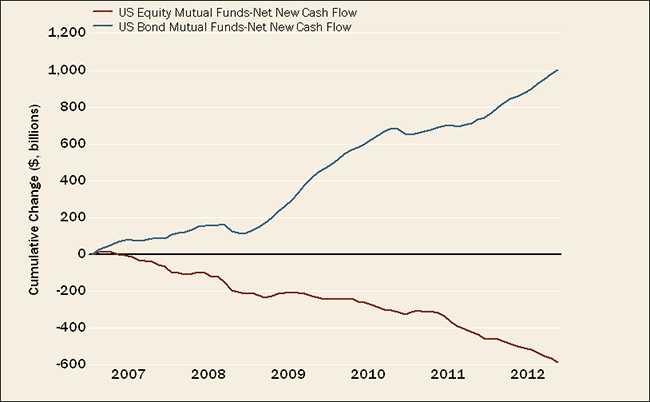
As you can see in the chart below, investors have poured nearly a trillion dollars into bond mutual funds since 2007, while pulling over half that much out of stock funds. Many investors have missed out on the more than doubling of the market since March 2009. If new highs for the S&P 500 are hit this year—a good possibility, in my opinion—it could finally be the trigger to attract more money to the stock market.
Record Bias Toward Bond Funds

Source: FactSet, Investment Company Institute (ICI), as of November 30, 2012.
An improving economic outlook would accrue to corporate earnings, upon which I believe valuations remain reasonable. I'm assuming nominal GDP growth could be close to 5% in 2013 (2.5–3.0% real GDP plus inflation). According to Ned Davis Research, assuming S&P 500 sales adhere to their average over the past 30 years, earnings should grow about 0.5% above GDP. Margins are likely to be no better than flat this year. With dividend taxes going up for higher-income folks, it could entice some companies to swap some dividend for buybacks.
The end result would have S&P 500 operating earnings growth approaching 9% for this year, which would be an acceleration from 2012's 3.4%. However, it's lower than the present 13.6% consensus for growth. As we've been opining for some time, risks are to the downside for 2013 earnings estimates. That said, valuation on those earnings appears reasonable at about 13 times earnings assumed with a 9% growth rate—well below the long-term average of greater than 16.
Risks remain
In the near term, the biggest risk for the economic and market outlook would be a protracted battle on the debt ceiling and/or spending cuts that mirrors what happened in late-summer 2011, particularly if accompanied by a debt-rating downgrade by one or more of the rating agencies.
Beyond that, another potential risk is inflation, which could initially be felt in commodity prices if the global economy continues its recovery. Given that most global central banks operate with only one mandate—fighting inflation (inclusive of commodity prices, unlike the Fed's "core" inflation mandate)—higher inflation could derail the global liquidity story that's developed.
For shorter-term market watchers, I suggest keeping an eye on sentiment and technical indicators to gauge whether the rally might take a breather, as is certainly possible. But looking beyond the next couple of months, I think a brighter 2013 is in store.
Happy New Year to you all.
*******
Important Disclosures
The S&P 500 Index is an index of widely traded stocks. Indexes are unmanaged, do not incur fees or expenses and cannot be invested in directly.
The information provided here is for general informational purposes only and should not be considered an individualized recommendation or personalized investment advice. The investment strategies mentioned here may not be suitable for everyone. Each investor needs to review an investment strategy for his or her own particular situation before making any investment decision.
All expressions of opinion are subject to change without notice in reaction to shifting market conditions. Data contained herein from third party providers is obtained from what are considered reliable sources. However, its accuracy, completeness or reliability cannot be guaranteed.
Examples provided are for illustrative purposes only and not intended to be reflective of results you can expect to achieve.


