2013 Investment Outlook
by James Paulsen, Chief Investment Strategist, Wells Capital Management
We expect 2013 to deliver a fifth consecutive year of positive equity returns. In the last four years, the S&P 500 has produced almost a 15 percent annualized total return (compared to only about a 6 percent annualized return from long-term government bonds and while inflation only annualized 2.3 percent) despite a cultural mindset dominated by numerous fears and widespread doubts which chronically warned investors to be careful. That is, the bull market recovery has thus far climbed a perpetual wall of worry. Next year, however, a slow but steady rise in confidence will likely drive the S&P 500 above its previous all-time high of 1565 and perhaps even as high as 1700 sometime during the year. Although earnings may only rise modestly, improved equity valuations, pushed higher by a more confident investor with an elongating horizon, should prove the primary catalyst for the stock market. Moreover, improved confidence may also finally bring havoc to the bond market. Rising yields could result in negative bond returns encouraging a reallocation of mutual fund flows back toward equities.
Several key points regarding this outlook are worth highlighting.
Consensus economic growth expectations are too low
The consensus forecast for only 2 percent real GDP growth next year is tied to an expectation of significant fiscal tightening. Even though fiscal policy will be a headwind for growth in 2013, the degree of fiscal drag is probably overstated. The most likely outcome is a modest austerity program (tax hikes and spending cuts) implemented slowly over many future years which should not overwhelm economic growth. Furthermore, several other positive forces are being overlooked which should more than compensate for a bit of fiscal tightening.
A previous note (see the November 27, 2012 Economic and Market Perspective Update) highlighted several reasons why U.S. real GDP growth will likely be closer to 3 percent next year rather than the current consensus expectation of only 2 percent. First, although the pace of economic growth remains frustratingly slow, the character of the U.S. recovery has broadened significantly in the last year as it is now firing on more cylinders than ever. Average monthly household job gains have been stronger than at any time in the recovery, the U.S. labor force has finally been growing steadily, the unemployment rate has declined by its largest amount and by its most sustained pace in the last 14 months, the household debt service burden is back near all-time record lows, household net worth has almost fully recovered from the 2008 recession, consumer confidence recently rose to a 4-year high, housing activity and home prices have finally been steadily improving, weekly bank loans have increased persistently in the last year, total state tax collections have reached new all-time highs, and the stock market is near its highest level of the recovery. As we enter 2013, the U.S. recovery has broadened considerably, become much more sustainable, and consequently much less vulnerable to external shocks. While economic fears have persistently dampened economic growth, rising confidence in the sustainability of this recovery should help boost the “pace” of economic growth next year.
Second, several economic policies remain conducive to economic growth and should help minimize or offset restrictive fiscal policies. Growth in the money supply remains robust, mortgage yields remain near all-time record lows, gasoline prices have declined to their lowest level of the last year, the U.S. dollar is about 10 percent below recovery cycle highs, and consumer price inflation has declined from about 4 percent in late 2011 to 1.8 percent today helping to stretch real incomes. Moreover, while superstorm Sandy will lower fourth quarter real GDP growth it will boost growth in 2013. Overall, economic policy (i.e., fiscal tightening; monetary easing; Sandy stimulus; and gas price, dollar, and inflation easing) is far more accommodative than appreciated and will likely “improve” economic growth next year.
Third, Chinese and other emerging world officials have been easing economic policies in the last year and recent evidence suggests most emerging economic recoveries are reaccelerating. Better growth among emerging economies would help the U.S. recovery in a number of ways. It would likely dissolve global recession fears which were prevalent throughout 2012 (with growing economies in both the U.S. and the emerging world, the global recovery would appear sustainable) helping to boost U.S. business confidence. It would also reduce concerns about ongoing problems in the eurozone. A growing emerging world improves global demand growth and simply makes chronic problems emanating from Europe less daunting. Lastly, it would restart the global manufacturing cycle. Worldwide, manufacturing activity has been tied to the pace of growth among emerging economies. A restart of economic growth in China would also likely improve manufacturing activity in both the U.S. and Germany which slowed considerably during 2012. Will the U.S. economy simultaneously enjoy rising housing and manufacturing activity for the first time in 2013?
Finally, for the first time since the European crisis surfaced in early 2010, a policy of austerity (a contractionary program) has been replaced by “growth promoting” economic stimulus (including lower ECB interest rates, a massive expansion in the ECB balance sheet, and direct ECB buying of periphery bonds). Although already in recession, this recently adopted pro-growth policy approach should improve eurozone economic performance in 2013. Germany should directly benefit as global manufacturing improves and the rest of the region should exhibit some signs of economic revival even if it only amounts to rising from 10 feet to only 5 feet underground. Perhaps most importantly, economic fears surrounding the eurozone, which have already lessened some in recent months should calm even further in 2013. A broadly geared and growing U.S. economy, a revitalized emerging economic cycle, and a less calamitous eurozone should help lessen anxieties, accentuate business animal spirits, and perhaps awaken pent-up investment and hiring demands.
This recovery has been chronically disappointing. U.S. economic growth has fallen short of consensus real GDP growth forecasts at the beginning of each year. Could 2013 prove to be the first year in this recovery when actual U.S. economic growth “outpaces” consensus expectations?
2013 is not so much about earnings.....
Earnings performance is paramount for many investors. So far in this recovery, earnings growth has been achieved despite only modest sales gains because of a record-setting improvement in profit margins. Since profit margins are now near post-war highs, many worry future earnings growth will not be sufficient to keep the stock market rising.
We agree earnings growth will be much more modest in future years. Indeed, S&P 500 earnings growth during the rest of this recovery cycle will likely average slightly less than nominal GDP growth assuming a regression to the mean for profit margins. We do not, however, believe this suggest the stock market has already seen its best performance.
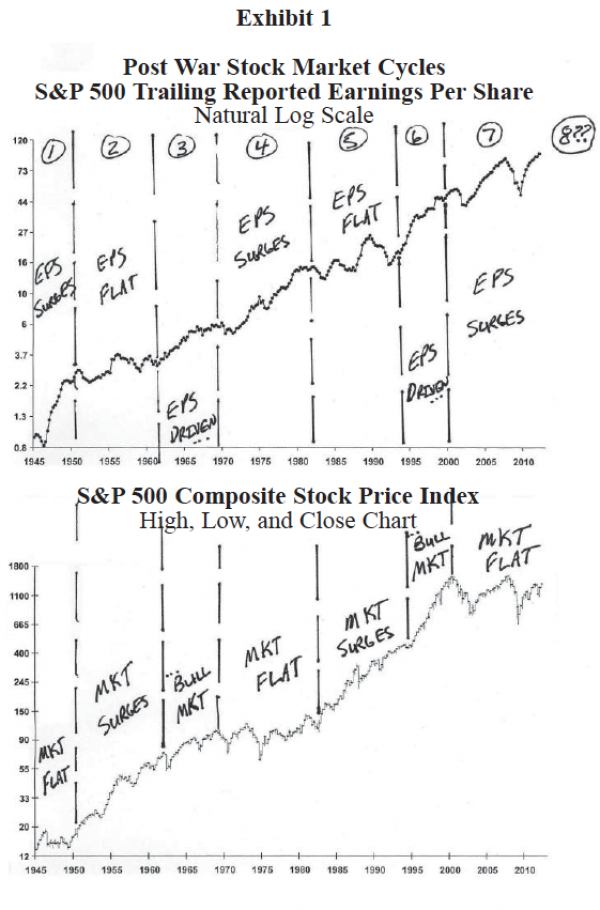
As illustrated in Exhibit 1, since 1945, the U.S. stock market has fluctuated between valuation and earnings cycles. Both the scope and scale of these recurring valuation/earnings cycles have been remarkably similar.
Stage 1. Earnings Production—Earnings surge while stock prices trend sideways over a series of years.
Stage 2. Getting Paid—A valuation-driven stock market whereby investors are finally “paid” for earnings previously produced. Stock market surges even though earnings per share trend sideways.
Stage 3. Traditional Run—A stage when both earnings and stock prices rise (i.e., a traditional earningsdriven stock market).
Historically, stock market cycles have been driven at different points by earnings gains and by valuation gains. As we enter 2013, we believe much of the earnings cycle for this recovery is past and we may be entering a second stage where stock market gains are more tied to valuation enhancements.
This historic cycle—earnings production, getting paid, and the traditional run—has already begun its third iteration of the post-war era. While each repetitive cycle has of course been unique, they all have shown a tendency to rhyme! Stage 1 is evident in the 1940s, 1970s, and since 2000 when earnings surged (e.g., S&P 500 earnings per share have more than doubled since the end of 1999) while the stock market in each case was essentially flat. Stage 2 is illustrated by the periods between 1950 and 1962 and by the period between 1980 to about 1993 when earnings were essentially flat but the S&P 500 price index surged higher. Finally, the traditional run—when both earnings and stock price rose together—is shown by the period between 1962 to 1970 and again by the late-1990s.
Since 1999, the experience of the “lost decade” looks amazingly similar to the character of the “earnings production” stage which occurred at the beginning of each of the last two major stock market cycles. That is, earnings have more than doubled while the U.S. stock market has been essentially flat. The next two stages could certainly depart from the character of the last two stock market cycles. The contemporary cycle could be prematurely aborted by numerous problems including another financial crisis, a war, or by escalating inflation. However, should this cycle continue to rhyme with the previous two post-war cycles, it may be time to worry less over earnings growth (which could be very modest indeed in the next few years) and focus more on how much valuations could rise as confidence continues to improve and investment horizons are lengthened? We believe the stock market cycle has already begun to enter stage 2—the “getting paid” part of the cycle where stock prices are less dependent on earnings and more driven by rising PE valuations.
…But rather, may be mostly about confidence!
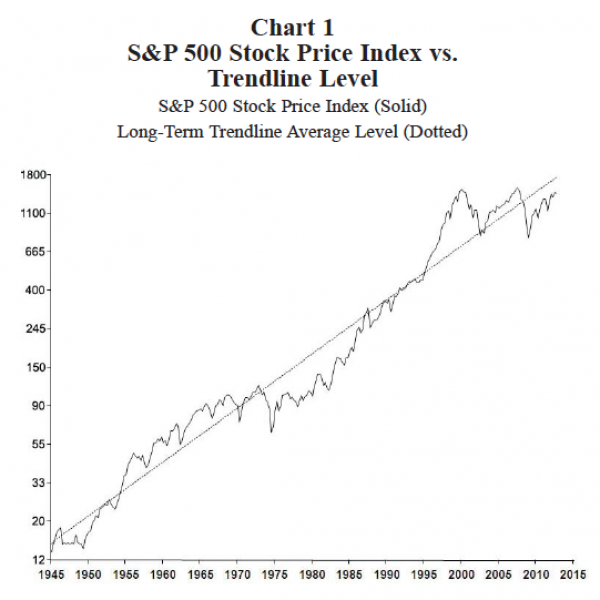
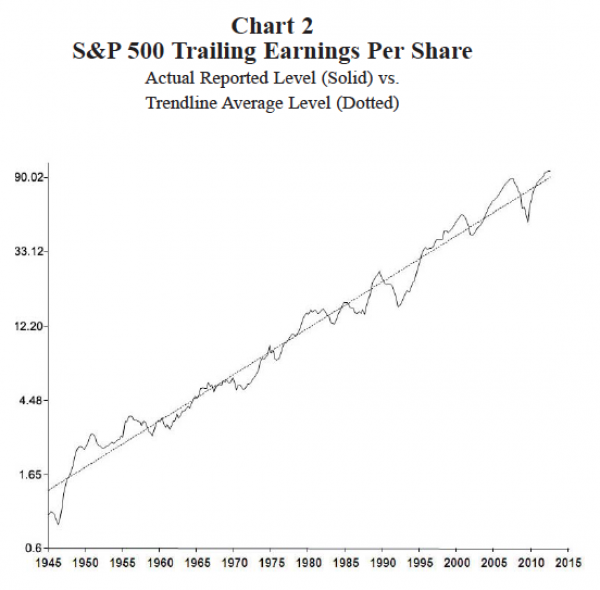
Fear (a lack of confidence) has proved to be a chronic liability for both the economy and the stock market since 2008. As we enter the “getting paid” stage of this stock market cycle, a slow but steady resurrection of confidence may now prove the stock market’s greatest asset. Exhibit 2 illustrates just how important confidence has been throughout the post-war era in establishing the “valuation level” of the stock market. Charts 1 and 2 in Exhibit 2 displays the S&P 500 Stock Price Index and S&P 500 earnings per share relative to their respective long-term trendline (dotted lines) averages. Corporate earnings have already reached a new all-time high in this recovery, above its post-war trendline level. As Chart 2 shows, the earnings performance in recent years is as good as at any time throughout the post-war era, rising in line with its long-term trendline results.
Although stock prices are ultimately tethered to earnings performance, in the short-run, the stock market often trades at a premium or discount to its trendline. As illustrated in Charts 1 and 3, the difference between the stock market and its trendline (in Chart 1) is a good proxy for investors’ valuation of the longterm earnings trend. Since 2008, for the third time in post-war history, the U.S. stock market is trading persistently “below” its trendline. This also occurred after WWII until the mid-1950s and again between the early-1970s until the late-1980s.
What causes investors to value the earnings trend sometimes at a 25 percent (or more) premium and other times at a 25 percent (or larger) discount? Certainly, multiple factors comprise this complicated valuation. During the late 1940s, the discount to trendline seemed driven by a post-war pessimism, in the 1970s escalating inflation and interest rates drove valuations lower, and in the contemporary period persistent anxieties surrounding the potential for a global financial calamity have dominated. By contrast, the huge premium paid by investors for trendline earnings in the 1960s coincided with attitudes reflected in the “Great Society Years” while the record-setting premium valuation reached in the late-1990s was a product of a “New-Era” mania.
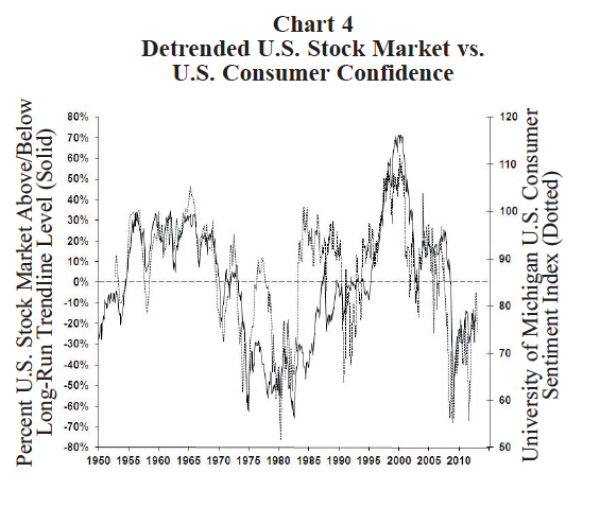
As shown in Chart 4, the discount or premium valuation of the stock market relative to its trendline is perhaps best explained by economic “confidence.” This chart overlays the percentage differential of the stock market relative to its trendline with the consumer confidence index. Although not a perfect relationship, the level of confidence has done a good job tracing changes in the “valuation of the earnings trend” during the post-war era.
Since at least 1950, the valuation of the stock market has corresponded closely with periods of strong economic confidence and periods of broad economic fears. Currently, confidence is hovering in the lowest quartile of its post-war range and the U.S. stock market is about 25 percent below its trendline. This is not a coincidence. Similar to the period between 1950 and the mid-1960s and again in the 1980s, a slow but steady revival in U.S. confidence could represent the biggest driver of stock market performance in the next several years! Is this already happening? The S&P 500 has risen by about 13 percent in 2012. About 10 percent of this price gain is due to a rise in the price-earnings (PE) multiple. The PE on trailing earnings was about 13 times at year-end 2011 and has risen by about 10 percent to 14.4 times currently. Why did the PE multiple rise in 2012? Because, this year consumer confidence rose steadily and as it did the PE multiple also increased. Perhaps, in 2012, we entered the “getting paid” stage of the long-term stock market cycle. Already a slow but steady revival in economic confidence seems to be driving the stock market higher by slowly improving equity market valuations. We expect this to continue in 2013.
Is an S&P 500 target price of 1700 reasonable in 2013? Currently, share earnings are almost $100 and should end 2012 slightly above this level. Assume S&P 500 earnings grow in line with nominal GDP next year and both only rise about 5 percent (3 percent real and 2 percent inflation). Also assume confidence improves further next year as investors agree the recovery is sustainable and begin to elongate investment horizons. Finally, assume (as it did in 2012) rising confidence improves the PE multiple by 10 percent from about 14.5 to about 16 times as earnings approach about a $106 (the combination provides a 1700 price target for the S&P 500 Index)?
Exhibit 2
Will rising confidence produce bond PAIN in 2013?
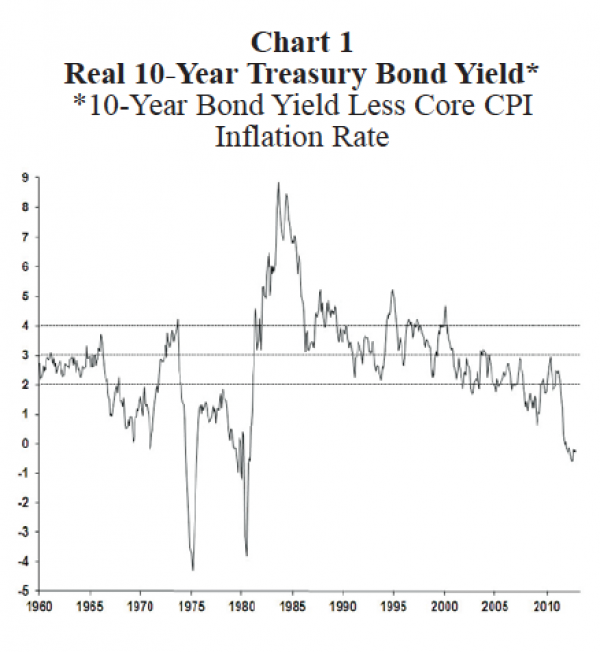
Value buyers need to look beyond the bond market. Chart 1 in Exhibit 3 shows the historic valuation of the 10-year Treasury yield relative to the annual core consumer price inflation rate. The dotted lines suggest a normal historical valuation range is a bond yield between 2 and 4 percent above the rate of core inflation. Today, just to reach the bottom of this normal valuation range, the 10-year yield would need to rise to about 4 percent. Moreover, relative to the core inflation rate bonds are currently more expensive than about 95 percent of the time since 1960. Not only should bond investors have paltry return expectations, but bond holdings may become hazardous to investment health.
Although renewed confidence might be a catalyst for the stock market next year, it may also be a harbinger of pain for bond investors. Chart 2 in Exhibit 3 shows that during the “lost decade” since 2000, the bond market’s best friend has been FEAR. It compares the 10-year real Treasury bond yield with the consumer confidence index. The general trend and cyclical movements of the real Treasury yield since 2000 correspond quite closely with fluctuations in confidence. Confidence was destroyed since 2000 by a plethora of events including the dot.com meltdown, the 9-11 terror attack, multiple Middle East wars, the Great 2008 Recession and by chronic stories of Armageddon in its aftermath. The combination and persistency of these scary events have increasingly driven investors toward safe-haven investments (Treasury and other high quality bonds) whose popularity has not diminished even though the 10-year yield has been below the core inflation rate in the last year.
Just as escalating fears chronically boosted bond returns for more than a decade, a slow but steady resurrection of confidence in the years ahead may finally propel yields higher. Moreover, during the last year, confidence has risen close to its highest levels of the recovery creating the largest divergence yet between confidence and real yields since at least 2000. Based on the relationship exhibited in Chart 2 since 2000, the current confidence level normally has been associated with a 10-year Treasury bond yield about 2.5 percent above core consumer inflation (or currently at about a 4.5 percent yield). Should confidence improve further next year as we expect, a potentially violent upward surge in the 10-year Treasury bond yield to around 3.5 percent would not be surprising.
Exhibit 3
Will shifting mutual fund flows impact stock & bond returns in 2013?
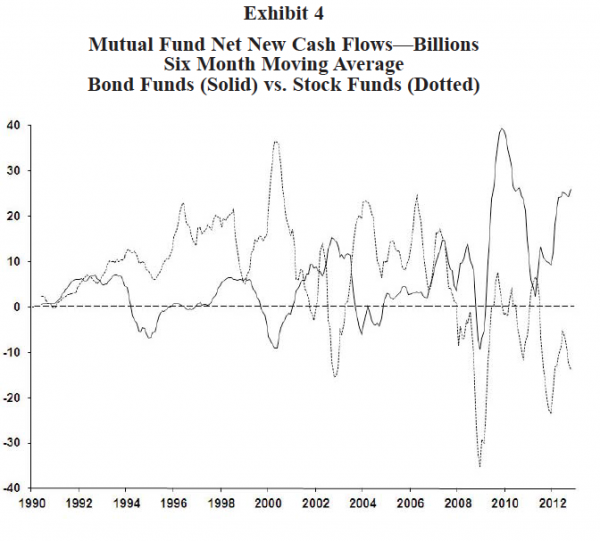
Exhibit 4 shows the six month moving average of net new cashflows into both stock and bond mutual funds since 1990. In this recovery, with only brief and small exceptions, there has been a steady flow out of stock funds toward bond funds. Indeed in the last six months, bond funds have gained almost $25 billion a month while stock funds have seen outflows averaging about $15 billion! Certainly, the “safehaven” popularity of bond funds has thus far helped keep bond yields low in this recovery while at the same time the demand for equities has been held down by a steady liquidation of stock funds. We think two factors could reverse this trend in the coming year.
First, if bond yields do move higher in 2013 and fixed-income returns turn negative, the “pain” of safe-haven investments may force investors to question whether they are too exposed to bonds. Second, we think the S&P 500 will likely breach its all-time record high of 1565 sometime next year. If this occurs, the national investment conversation and business media focus will be significantly altered. In the shadow of the great 2008 collapse, investors have been constantly warned to first and foremost ensure risk exposure is minimized. If a new all-time stock market high is reached next year, investment discussions will begin to ask whether most are missing out by being too conservative.
An all-time record high for the stock market officially ending the “lost decade,” combined with some pain for bond investors who thought they would sleep well at night, might just significantly alter investment flows in 2013.
Exhibit 4
Armageddon stories are losing their punch!
Throughout this recovery, risk asset markets have chronically struggled with persistent “end of the world” stories. For example, rumors of additional major bank failures, fears of a massive municipal bond default, a secondary housing market collapse, a run on the U.S. dollar, the eurozone blowing apart, a hard landing in China, flash crashes, loss of AAA ratings, and falling off the fiscal cliff. However, as shown in Exhibit 5, after so many “false alarms” regarding a potential Armageddon, investors are finally desensitizing to crisis stories.
Exhibit 5 illustrates the stock market VIX volatility index. A spike in the VIX index reflects a panic in the stock market. When eurozone fears first emerged in 2010, “end of the world” fears caused a major surge in the VIX index as the stock market went into panic mode. This also happened in 2011 as eurozone fears again heightened and as the U.S. lost its AAA rating. However, this year, despite a spring slowdown in the economy which raised recession fears, despite renewed concerns about the eurozone, despite the uncertain election outcome, and despite fiscal cliff anxieties, the VIX index and the financial markets have reacted mostly with a big collective “yawn”! The boy has cried wolf too many times in recent years. Many investors were scared out of the stock market in 2010 and again in 2011 only to watch it twice subsequently rally to new recovery highs.
A decaying sensitivity to crisis bodes well for the new year. Confidence will not as easily be dented by ongoing stories of woe. Rather, perhaps both business and investor horizons will slowly be expanded if belief in a sustainable recovery emerges. Consumers already seem more confident stepping up to buy big ticket autos and homes in increasing numbers. Maybe next year, businesses will also show improved confidence by finally employing some cash and increasing capital spending. Most importantly for the stock market, a less crisis sensitive investor implies a lengthening of their investment horizons, discounting future earnings over a longer time period and thereby arriving at a higher valuation for stocks.
Exhibit 5
As we enter 2013, some worry the economic recovery and the investment cycle are rapidly aging. The bull market will be four years old in March and by post-war calendar time standards, both the economic recovery and the stock market run are getting long in the tooth. In terms of their “character,” however, both still look young.
Economic recoveries typically have not ended until excess capacity diminishes, until economic policies are tightened, and until excessive economic behaviors are evident. Presently, none of these factors are yet suggesting an aging recovery.
Despite being in its fourth year, as shown in Exhibit 6, the U.S. economy still has a large 6 percent output gap. In the post-war era, only the 1980 recovery ended “before” the output gap was closed. Moreover, the unemployment rate remains far above full employment at 7.7 percent and the factory utilization rate is still only 78.4 percent. Essentially, the economy is not currently facing any significant resource constraints which often signal an aging recovery. Indeed, with so much slack, the economy can grow for some time without aggravating inflation or interest rates in a significant way allowing ample room for higher stock prices.
Although fiscal policy will finally be tightened as we enter 2013, monetary policy, interest rates and bond vigilantes have not yet begun to lean against the recovery or the stock market. With 6.9 percent deficit to GDP stimulus, almost 8 percent M2 money supply growth, a continuation of an unprecedented size and growth in the Federal Reserve’s balance sheet, a zero short-term interest rate, a record low mortgage yield, and similar policies evident about the globe, from an economic policy standpoint, the recovery seemingly has not even made it out of the first inning yet.
Finally, contemporary economic and investment behaviors simply are not conducive to the end of a cycle. Often it is “excessive behaviors” based on overconfidence which plant the seeds for the end of a bull market. Such is not the case today. Have banks overlent? Is anyone overborrowing? Are household debt service burdens near record highs? Are individuals paying up too much for homes today? Is anyone lacking for liquidity? Are companies overinventoried, overstaffed or have they overbuilt? Are pentup demand for big ticket homes, autos or capital spending extinguished? Are investors overextended toward the stock market, out of cash, or underallocated to bonds? Finally, are most overconfident about the future? The answer is no! The recovery cycle is probably still young because it will take more time before confidence returns to an extent that private players engage again in economic and investment behaviors which ultimately bring its demise.
Exhibit 6
Investment Recommendations!??
• Emerging Market Stocks?
As emerging world economic recoveries reaccelerate, emerging market stocks will likely provide the best returns in 2013. These markets have cheapened in the last couple years, are out of favor and under-represented in most portfolios. Moreover, these economies still offer the fastest growth available in the world. Finally, we anticipate most emerging currencies will slowly but steadily appreciate relative to the U.S. dollar adding to investment returns.
• International Developed Stocks?
Most developed stock markets will also likely provide solid returns again next year. We favor overweighting international developed markets relative to the U.S. primarily because we expect additional erosion in the U.S. dollar exchange rate. The broad U.S. dollar index is currently in the middle of a trading range established since 2007 and we expect it to trend toward the lower end of this range as crisis fears ebb and as the safe-haven premium of the U.S. dollar diminishes. We would slightly overweight both Europe and Japan which offer the best values and also have good relative momentum as we start the new year.
• Domestic Stock Market?
We expect the S&P 500 to deliver 15 to 20 percent returns in 2013 reaching a new all-time record high above 1565 and perhaps reaching as high as 1700 sometime during the year. We would overweight small cap stocks relative to large caps. First, large caps have outpaced in the last 18 months and values now favor smaller cap stocks. Second, we expect further gains in confidence next year which should diminish the appeal of the “safe-haven” character of large cap stocks. Third, smaller companies tend to have greater operating leverage in an economy whose growth rate is expected to accelerate. Finally, small cap companies tend to do best relative to larger companies when inflation rates rise. While we do not anticipate serious inflation pressures next year, we do think wage and consumer price inflation will begin to accelerate some before the end of the year.
• S&P Sectors Allocations?
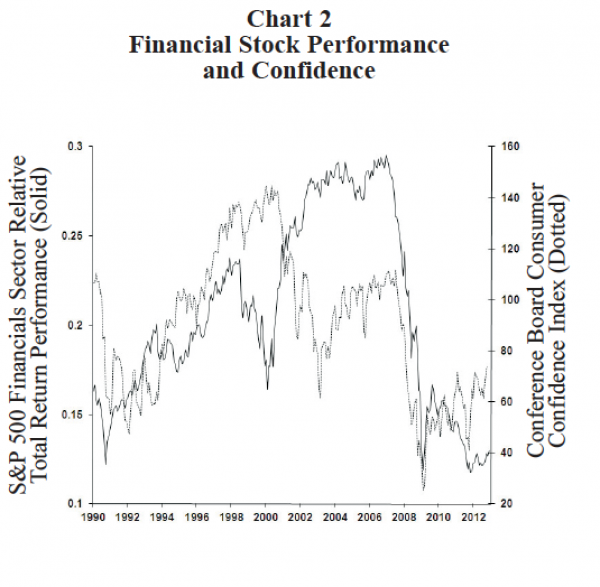
Overweights: S&P Industrials, Materials, and Financials. We anticipate an improved U.S. manufacturing cycle next year boosted by a reaccelerating emerging world economy. Chart 1 in Exhibit 7 illustrates how closely the relative performance of industrial stocks is related to the competitive standing of the U.S. dollar. Since early 2011, as emerging economies slowed, the U.S. dollar has mostly risen relative to emerging currencies. As emerging economies improve again, the U.S. dollar will likely weaken helping improve the relative total return performance of industrial stocks in 2013. A weaker dollar and rising global activity should also help materials stocks do better next year. Finally, the positive momentum exhibited by financial stocks in 2012 is likely to persist next year. Chart 2 in Exhibit 7 shows how important confidence is for the financial sector. Rising economic confidence probably helps financial stocks more than any other sector. The business of finance is mostly about confidence. Individuals do not borrow money, nor will banks extend credit without confidence in the economy. Financial deals like IPOs, M&As, and investment portfolio decisions are similarly not done without optimism about the future. If economic confidence continues to rise, the still relatively cheap financial stocks should provide another year of solid returns.
Exhibit 7
• An Opportunity: S&P Technology?
Tech stocks had a rough second half of 2012, which significantly improved their valuations. Corporations remain flush with cash and improved global growth could boost capital spending plans augmenting newera purchases. Although, we are currently neutral weighted in the tech sector (awaiting more evidence of a bottom in relative price action), we anticipate an opportunity to increase exposure sometime in 2013.
• Neutral Weightings: Healthcare and Energy.
Obviously, there are plenty of opportunities (winners and losers) in individual names within the health care industry for those whose closely monitor and analyze the impact of the new healthcare program and any potential forthcoming alterations. For the sector overall, however, the valuations are not compelling enough and the ongoing complexity and uncertainty surrounding this industry keeps us neutral. Relative valuations in the energy sector also remain neutral and the surge of domestic production capacity in recent years is likely to keep the price of crude oil range bound in the foreseeable future.
• Underweights: Consumer Discretionary, Consumer Staples, and Utilities.
The U.S. consumer should have another strong year in 2013 bolstered by continued job gains, low interest rates, moderate inflation, and rising home prices. However, the consumer cyclical stocks have been outperforming throughout this recovery and their stock prices already reflect additional consumer improvement forthcoming next year. We also would underweight staples and utilities. We think investors will opt for better earnings leverage available elsewhere next year and also expect a further erosion in the popularity of “safe-haven” assets in 2013. Finally we are leery of overweighting interestsensitive sectors like utilities in a year which could turn hostile for bonds.
• Commodities?
Overall, the economic environment should be hospitable for the commodity markets next year including a revival in global economic growth, faster growth in the U.S. than currently anticipated, a further erosion of the U.S. dollar, and perhaps some creeping inflationary anxieties before the year is over. However, we suspect the performance of commodities will prove very disparate. We like industrial commodity prices which have recently started a recovery in line with evidence of improved growth in emerging world economies. Industrial prices should continue to advance next year as global economic growth proves stronger than most anticipate. However, most agricultural prices were temporarily boosted by a drought in 2012 and will likely decline this year with a more normal weather pattern. Precious metals prices may also be pressured by a diminishing need for safe-haven assets as confidence about a sustainable global recovery broadens. Finally, domestic oil production has risen so much in recent years, oil prices seem less sensitive to spikes due to tight supplies even if improved economic growth increases demands.
• Bond Market?
We are conservative in our approach to the bond market for 2013. With a current inflation rate of about 2 percent, the 10-year Treasury yield would need to rise to about 4 percent just to be reasonably priced. We expect U.S. economic growth to surpass expectations next year, for the U.S. dollar to weaken, for industrial commodity prices to rise, and believe wage inflation may bottom (even if from very low levels) before the year is over. Such a cocktail could produce a nasty bond market sometime during the year. We would not be surprised by a violent move in the 10-year Treasury bond yield to 3.5 percent. Portfolio allocations should remain underweight to fixed-income assets, favor lower quality over higher rated, and durations should be held below benchmark averages.
Happy New Year.....We Think!??!
The new year will likely produce a fifth consecutive year of positive returns for stock investors and may result in a negative return for the 10-year Treasury bond. A persistent rise in confidence and a diminished sensitivity to crisis may be the highlights of 2013. As we begin the new year, this renewed confidence is perhaps the result of strides made on many fronts. We have finally made “progress” (assuming some near-term announcement) on fiscal challenges, have “calmed” eurozone fears, have “revived” China and emerging world recoveries, have “geared” (now firing on more cylinders than ever) the U.S. economic recovery, and have “restored” balance sheets (U.S. household debt service burden is back close to record lows and most banks are now well capitalized). A nice combo package of accomplishments which hopefully will truly bring a “Happy” New Year!
Important Disclaimer
Wells Capital Management (WellsCap) is a registered investment adviser and a wholly owned subsidiary of Wells Fargo Bank, N.A. WellsCap provides investment management services for a variety of institutions. The views expressed are those of the author at the time of writing and are subject to change. This material has been distributed for educational/informational purposes only, and should not be considered as investment advice or a recommendation for any particular security, strategy or investment product. The material is based upon information we consider reliable, but its accuracy and completeness cannot be guaranteed. Past performance is not a guarantee of future returns. As with any investment vehicle, there is a potential for profit as well as the possibility of loss. For additional information on Wells Capital Management and its advisory services, please view our web site at www.wellscap.com, or refer to our Form ADV Part II, which is available upon request by calling 415.396.8000. WELLS CAPITAL MANAGEMENT® is a registered service mark of Wells Capital Management, Inc.
Copyright © Wells Capital Management


